|
One Ecosystem :
Ecosystem Service Mapping
|
|
Corresponding author: Ina Maren Sieber (sieber@phygeo.uni-hannover.de)
Academic editor: Evangelia Drakou
Received: 27 Feb 2018 | Accepted: 06 Jun 2018 | Published: 12 Jun 2018
© 2018 Ina Maren Sieber, Paulo Borges, Benjamin Burkhard
This is an open access article distributed under the terms of the Creative Commons Attribution License (CC BY 4.0), which permits unrestricted use, distribution, and reproduction in any medium, provided the original author and source are credited.
Citation:
Sieber I, Borges P, Burkhard B (2018) Hotspots of biodiversity and ecosystem services: the Outermost Regions and Overseas Countries and Territories of the European Union. One Ecosystem 3: e24719. https://doi.org/10.3897/oneeco.3.e24719
|
|
Abstract
The obligations of the EU Biodiversity Strategy 2020 create a need for mapping and assessment of the state of biodiversity, ecosystems and their services in all European member states. Europe’s nine Outermost Regions (ORs) and 25 Overseas Countries and Territories (OCTs) are mainly islands, scattered around the globe. These territories contain unique flora and fauna and encompass diverse ecosystems, from coral reefs to rainforests. These highly diverse ecosystems provide multiple relevant ecosystem services from local to global scale. To date, the ecosystem services concept has so far received little attention in European ORs and OCTs. Therefore, our aims were (1) to analyse the current state of ecosystem services mapping and assessment in Europe’s overseas territories, (2) to identify knowledge gaps in the context of ecosystem service research and application and (3) to provide recommendations for future research and policy directions to fill these gaps. We conducted a systematic review of scientific literature for each of the ORs and OCTs, screening 1030 publications. The analysis resulted in 161 publications referring to ES mapping and assessment, of which most were conducted in the European Caribbean (31%) and Pacific (21%) territories. Results show that many ORs and OCTs are still blank spots in terms of ecosystem service mapping and assessment and that, despite many biodiversity studies referring to species’ abundance, little has been published on ecosystem services. Our systematic review highlights theknowledge lacking on dealing with invasive species, which pose major threats to native island biodiversity, ecosystem functions and ecosystem services. Further, it discusses knowledge gaps in (1) translation of information on island biodiversity and ecosystem functions into ES; (2) geographical coverage of mapping studies in most ORs and OCTs; (3) the lack of standardised approaches and integrated assessments to map, assess and value ecosystem services. Based on these results, future research and policy priorities could be adapted in order to focus on filling these gaps. To overcome current environmental policy challenges, it is crucial to address the ongoing decline in biodiversity, rising climatic and anthropogenic pressures on ecosystems and to maintain a sustainable ES flow to safeguard human well-being. Ultimately, ES mapping and assessment efforts will form the knowledge base for well-informed decision-making to protect Europe’s vulnerable overseas areas.
Keywords
Mapping and Assessment of Ecosystems and their Services, European Union, invasive species, review study
Introduction
Mapping and Assessment of Ecosystems and their Services (MAES) have received growing attention within the European scientific, policy and practitioner communities to safeguard biodiversity and sustain land use management (
Extensive mapping and assessment efforts can be seen on the European mainland (e.g. EU-initiated initiatives and projects such as MAES, ESMERALDA*
Europe’s Outermost Regions (ORs) and Overseas Countries and Territories (OCTs) often seem to be overlooked in MAES efforts. ORs are territories located at distance from continental Europe but make up substantial parts of EU Member State’s territories. ORs include the Azores, Madeira, Canary Islands and the French Overseas departments of French Guiana, Guadeloupe, Martinique, Saint Martin, La Réunion and Mayotte. OCTs are territories that have a special bond with EU Member States of either France, United Kingdom, Denmark or the Netherlands. These 25 territories are associated by EU law rather than by constitutional law of an EU Member State (
The EU overseas areas are rich in biodiversity and natural resources, ranging from polar seas in Greenland, wetlands, coral reefs and volcanic islands to tropical forests (
Today, ecosystems in many ORs and OCTs are threatened. Temperate, semi-tropical and tropical oceanic islands have experienced serious lowland clearance, leading to land cover and land use changes, forcing the last remnants of pre-human pristine forest to higher elevations. In addition, the complex interplay between the EU Agriculture Policies (EU mainland-driven) and land use intensification in small territories have affected native ecosystems severely (
The EU has started to protect key ecosystem functions and services in terrestrial and marine overseas environments. In 2010, the European Parliament approved a Preparatory Action inspired by the voluntary scheme for Biodiversity and ES in Territories of European Overseas (BEST*
Despite these efforts, a review of EU-wide databases on ES and biodiversity, such as the Biodiversity Information System for Europe*
Therefore, this paper aims to assess the current state of knowledge on MAES in ORs and OCTs in more detail. We present a thorough literature analysis of published peer-reviewed scientific literature on the topic of MAES in EU Overseas to:
- review past and current ES mapping and assessment efforts,
- identify knowledge gaps in the context of ES research and application, including the role of invasive species on ES and
- to provide recommendations to future research and policy directions to fill these gaps to contribute to ES mapping and assessment efforts in ORs and OCTs and to reach EU-wide as well as global biodiversity targets.
The paper is structured as follows: Section 2 describes the methodology used to structurally review the ES mapping and assessment efforts in Europe’s Overseas. Section 3 presents the results of the literature analysis on the topic, providing the baseline for current efforts, as well as touching upon the threat of invasive species jeopardising biodiversity and conservation efforts. Section 4 discusses the results in terms of geographical coverage of MAES in ORs and OCTS. Furthermore, this section presents current knowledge gaps, such as diverging conceptual frameworks, data and the need for comparability of ES mapping and assessment efforts. This section also provides an outlook for future research and guidance for enhanced policy-making concerning MAES in ORs and OCTs. Cross-cutting conclusions are drawn in Section 5.
Methodology
Our systematic review followed the Preferred Reporting Items for Systematic reviews and Meta-Analyses (PRISMA) statement (
Data Sources
The sources of relevant articles for this literature study were tripartite: First, peer-reviewed scientific literature, published in English language, was screened for publications on ES in ORs and OCTs. We selected Scopus (Elsevier) and Web of Science (Thomson Reuters), the two largest scientific databases for environmental and social sciences, for our search. Second, relevant scientific literature (published in English) designed to identify the current status of ES mapping and assessment was obtained from Google Scholar, including to some extent also grey literature. However, grey literature that was not publicly available or not published in English was not included in this review. As a third source, the review included policy documents and empirical studies that were presented during the first MAES OR&OCT expert workshop within the scope of the ESMERALDA EU Project in Ponta Delgada, Azores, from 28.02.-03.03.2017.
Data collection and analysis
The publications were reviewed in four steps (see Fig.
Keywords used in this systematic literature review, searching the databases Scopus, Web of Science and Google Scholar (adjusted from
|
Keywords referring to ecosystem services |
Keywords referring to mapping |
Keywords referring to the ORs and OCTs |
|
“ecosystem” |
“mapping” |
Greenland |
|
“ecosystem services” |
“map” |
Saint-Pierre and Miquelon |
|
“ecosystem services assessment” |
“geospatial” |
Azores |
|
“ecosystem mapping” |
“geographic information system” |
Madeira |
|
“ecosystem service map” |
“GIS” |
Canary Islands |
|
“biodiversity” |
“landscape” |
Bermuda |
|
“biodiversity assessment” |
“cartography” |
British Virgin Islands |
|
“remote sensing” |
Anguilla |
|
|
Saint Martin |
||
|
Saint Barthélemy |
||
|
Guadeloupe |
||
|
Martinique |
||
|
Netherlands Antilles |
||
|
Aruba |
||
|
Montserrat |
||
|
Cayman Islands |
||
|
Turks and Caicos Islands |
||
|
French Guiana |
||
|
Wallis and Futuna |
||
|
French Polynesia |
||
|
Pitcairn |
||
|
New Caledonia |
||
|
Ascension Island |
||
|
Saint Helena |
||
|
Tristan da Cunha |
||
|
Falkland Islands (Malvinas) |
||
|
South Georgia and the Southern Sandwich Islands |
||
|
British Antarctic Territory (BAT) |
||
|
Adélie Land |
||
|
French Southern and Antarctic Territories (TAAF) |
||
|
Scattered Islands |
||
|
Mayotte |
||
|
Réunion |
||
|
British Indian Ocean Territory (BIOT) |
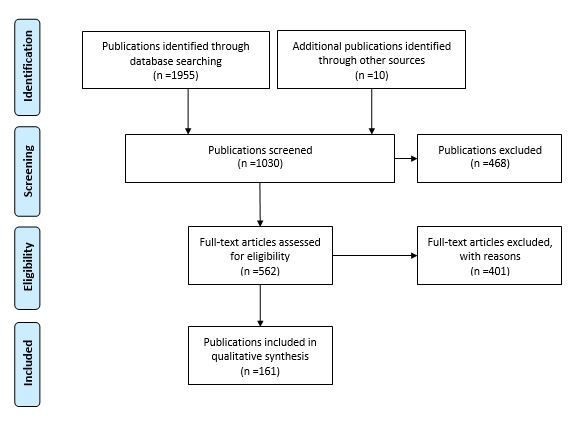
The screening provided 1030 papers divided over the global regions of Amazonia, Macaronesia, the Caribbean, Indian Ocean, Pacific, Polar and Subpolar regions as well as the EU regions and territories in the South Atlantic (Fig.
In a second step, articles were catalogued and categorised, using an adjusted version of the ES mapping and modelling blueprint (
- Year of publication
- Global and geographical region of mapping and assessment per publication
- Dimension of study (biophysical, social, economic, socio-economic)
- Type of Study (Mapping, assessment, review, indicator development, biodiversity, other)
- Spatial scale of mapping (global, multi-national, national, subnational, local, other)
- Ecosystem type considered (urban, cropland, grassland, woodland and forest, heath and shrub, sparsely vegetated, wetlands, rivers and lakes, transitional waters, coastal or marine/coral reefs)
- Information on the role of invasive species, if mentioned
- Ecosystem classification schemes (CICES, TEEB, MEA, not defined)
- Ecosystem services cascade classification per ES described
- Ecosystem service described
- Input data (GIS, remote sensing, statistical data, expert opinion, field data, literature, others)
In addition, all publications were categorised according to the ES Cascade conceptual model (
Results
The number of publications on biodiversity in ORs and OCTs has been growing exponentially (Fig.
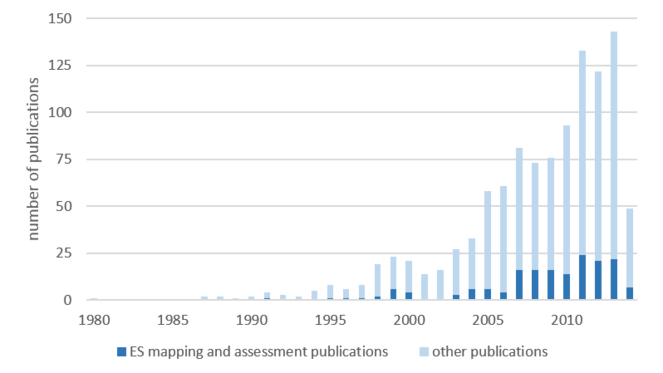
Number of all screened publications in this review. (In step 4 of Fig.
Geographical Distribution
The 161 ES mapping and assessment publications were spread over all 7 regions (Fig.
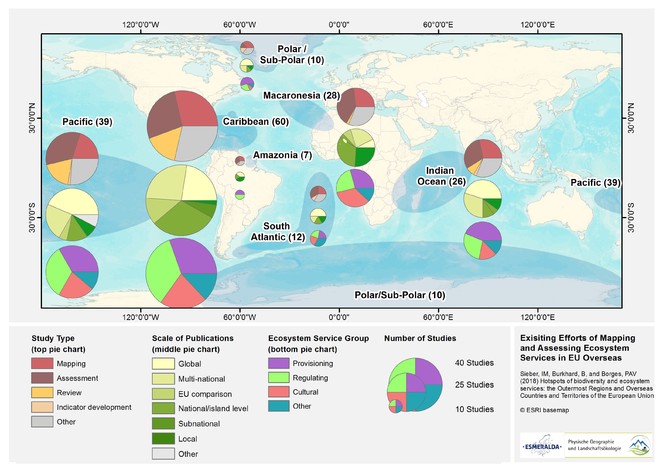
Geographical location of ES mapping and assessment studies in ORs and OCTs. All publications (n=161) obtained between April and June 2017 are included and divided by global regions. The map shows the number of case studies per region (number in brackets), their study type (top pie charts), scale of publication (middle pie charts) and group of ES assessed (bottom pie charts). Assessments at national or larger spatial scales are included in the map.
A higher number of studies was expected in the ORs, because of their closer legislative and administrative bonds with their respective EU Member States. However, this expected trend was not confirmed by the data. There were no clear differences between numbers of publications on ORs and OCTs or between northern or southern hemisphere. The numbers ranged from 4 publications in Guadeloupe to 18 on the Azores, which was the overall highest number on ES mapping and assessment-related studies in one of the regions considered in this review.
The majority of publications explicitly mentioned the ecosystem type in which the mapping activities took place (Fig.
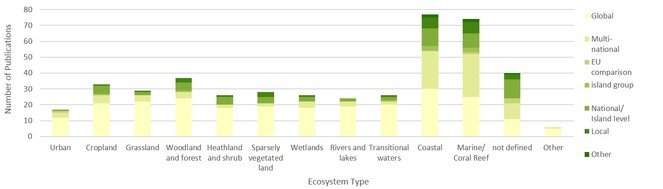
Overview of ecosystem types described in the 161 ES mapping and assessment publications and the spatial extent at which they performed (global, multi-national, within the EU context, island group, island level or local). Publications that did not define any spatial scale of analysis were classified as 'undefined'.
Short summary of the analysed studies
After presenting the results of the systematic review of the mapping and assessment studies, a short overview of the information included in the publications is given. This overview elaborates the ES classification, spatial coverage as well as the enormous impacts of invasive species on ecosystems in ORs and OCTs. The 161 publications included 72 ES mapping studies, 85 ES assessment papers and 28 review papers (Fig.
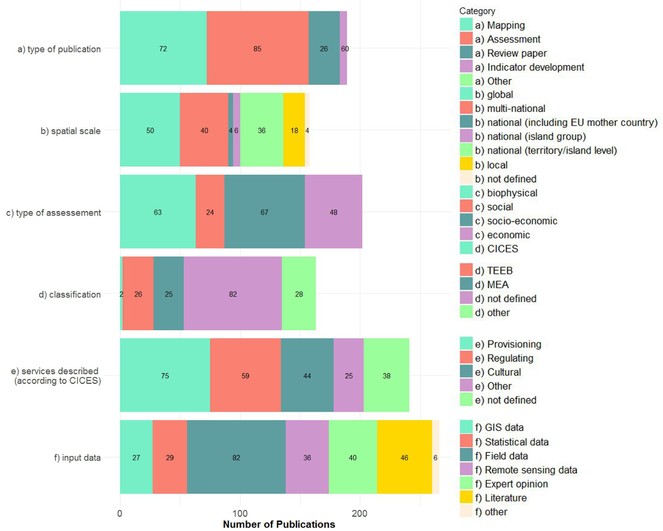
Overview of the individual literature review data variables for Europes ORs and OCTs. Data variables include: (a) type of publication (192 counts); (b) spatial scale (161); (c) type of assessment (202); (d) ES Classifications used (168); (e) ES described in literature (233) and (f) input data used in publications (264). Multiple counts per study were possible.
The ES classification applied in the study was left undefined in 82 publications (48%). For the publications that defined the ES classification, authors mostly used the TEEB*
Spatial scales used to describe the individual ES in the publications were heterogeneous. 53 studies referred to global and multi-national scales. That means that more than half of all publications that describe ecosystems and their services used maps with comparably less detail and lower resolution. 12 publications mapped or valued ES for island groups and 40 publications referred to specific ORs and OCTs. Only 3 publications compared the ORs/OCTs and their respective EU Member States (e.g.
Discussion
The results show that the number of ES mapping and assessment publications in European OR and OCTs has been constantly increasing. In the following, we will discuss past and current ES mapping and assessment efforts, knowledge gaps and future research needs.
Past and current ES mapping and assessment efforts
In EU comparison, most ORs and OCTs still show slightly skewed publication numbers in a) geographical coverage and b) spatial scale.
a) In terms of geographical coverage, some regions have been mapped more than others. With 60 out of 161 publications, the Caribbean region is covered most extensively. However, as the Caribbean hosts 13 EU OCTs and ORs, this results in an average of 4.5 publications per region. In comparison, the Macaronesian region is only covered by 30 publications spread over 3 ORs, which results in a higher density of published studies with an average of 10 studies per OR. Furthermore, publications are not equally spread over the territories within each region. With a maximum of 18 mapping and assessment publications, this review found the Azores Archipelago leading in ES mapping and assessment efforts, a number that is average compared to continental Europe (
There are several explanations for the overall low number of publications mapping EU overseas. Firstly, the legal complexity of EU law in ORs and OCTs obscures the necessity to implement the EU Biodiversity Strategy overseas. Whereas ORs are obliged to implement all EU laws and legislation, the legal status of the OCTs can differ for each territory (
The lack of ES maps can be explained by three factors. Firstly by the fact that such efforts usually take place on local scales and refer more to policy than to scientific levels. Therefore, peer-reviewed publications are often lacking for ORs and OCTs. Even though this review considered grey literature, existing efforts that are of internal nature and not publicly available could not be included in this review. Secondly, the remoteness and relatively small size of most regions encroach upon the importance of ORs and OCTs, because their contribution to EU Member States is often small in terms of economic impact or benefits (
b) In terms of spatial scale, the review showed that mapping and assessment of ecosystems and their services takes place on multiple scales, including local (e.g. provisioning ES of fishing capacity and effort (
We need to acknowledge that such global and multinational publications are important to provide a good overview and raise awareness on biodiversity and ES globally and multinationally. However, at policy level, it is important to understand where and what services are provided by an ecosystem, island, region or globally in order to monitor the achievement of policy goals (
Hence, both geographical and spatial coverage show fragmented ES mapping and assessment efforts in EU ORs and OCTs. Based on this fact and the general outcomes of the review, the following knowledge gaps were identifietd.
Knowledge gaps
Several knowledge gaps related to dealing with diverging conceptual frameworks, lacking knowledge on mapping and assessing island ES, the role of key biodiversity areas and marine protected areas, applied methods as well as information sharing, were identified for the ORs and OCTs:
a) The lack of common conceptual frameworks to analyse ES seems to be obvious in ORs and OCTs. Rather, a broad variety of concepts was found within the publications. The European Commission has set up a common conceptual ES framework within the EU Biodiversity Strategy (
b) This literature review showed a general lack of knowledge on mapping island ecosystems and the services they provide. As the current MAES efforts mainly focus on specific ecosystems, adjusted for continental Europe, comprehensive island ES maps are lacking. This review shows that trends observed in ES research in ORs and OCTs differ from European MAES efforts. Most comparable (global) literature reviews have found a strong focus on regulating ES (e.g.
c) Mapping in ORs and OCTs has often been reduced to key biodiversity areas (KBA) or marine protected areas (MPA) (
local scale is acknowledged, however, the flexible nature of resources (fish stock, larvae), the pressure of invasive species and chemical and biological pollutants affecting protected coastal ecosystems and the often inadequate size of the parks are amongst the main criticisms (
d) Most of the reviewed studies were applying economic and biophysical/ecological mapping and assessment methods. ES supply and demand are, however, embedded in the complex human-environmental system, requiring transdisciplinary research approaches that integrate methods and value domains from ecological, economic and social sciences. Our review found that researchers often apply methods that they are familiar with. Moreover, data sets used for research might contain gaps. As already described by
e) In addition, ways to store information on ES such as related data, metadata, maps and the like differ. Existing EU platforms to share case studies and publications are largely unused for ORs and OCTs, as the screening of databases like BISE*
The role of invasive species in ORs and OCTs
Biological invasions are a shared problem in all regions – about 25% of all reviewed studies mentioned invasive species and ecosystem disservices linked to alien flora and fauna. With typically limited biodiversity on islands, invasive species can alter ecosystem structures and processes and hence impact the provision of ES (e.g.
Whereas non-native invasive species have long been recognised as the largest cause of species loss in island ecosystems, the link between alien species and ecosystem (dis)services has just recently been established (
Future research needs for MAES implementation in ORs and OCTs
The high number of publications on biodiversity and ecosystem conditions in ORs and OCTs clearly indicates the importance of flora, fauna and habitats of the ORs and OCTs. As the numbers of publications on invasive species showed, there is an urgent need for nature conservation action. Moreover, there is the need to understand the role of exotic and invasive species on both ES and disservices in island native and human-made habitats. It is also important to identify the role of native insect pollinators or native birds as promoters of disservices, namely on helping plant invasions through, for instance, seed dispersal.
This review has found no studies that were officially carried out under the umbrella of MAES. Only a few studies have effectively identified or defined the goods and services derived from ecosystems and only a fraction of these publications mapped or assessed the respective ES. Past and current efforts are still skewed in terms of geographical and spatial coverage and conceptual frameworks diverge. In addition, data and the process of translating biodiversity and environmental studies into ES maps have still not clearly been communicated. Combined, these three areas of concern lead to limited comparability of studies across the EU, the overseas regions, landscapes and amongst ES maps. Experts criticise that such a broad variability, in technical and contextual aspects, would make it difficult to assess the individual and political value of such studies (
To enhance comparability between ES mapping and assessment studies, developing a standardised approach or one-size-fits-all solution would be unfavourable for the ORs and OCTs. Due to their immense diversity and special needs, such standardised approaches or lessons learned from continental EU might fail to obtain the data on ES mapping and assessment needed to enhance local decision-making and natural resources management. Rather, a flexible, guidance-based approach based on the vast knowledge on ES mapping and assessment from around the world needs to be developed, taking into consideration the individual ORs' or OCTs' needs. We strongly believe that developing such a flexible guidance for mapping and assessing ES that focuses on smaller spatial scales and finer resolutions can enhance local resources management for multiple, interacting ES bundles and a sustainable land management and biodiversity conservation in ORs and OCTs.
To achieve the targets of the EU Biodiversity Strategy 2020, a stronger emphasis on ES in the governance of ORs' and OCTs' natural resources and policy is needed. The MAES initiative needs much more exposure outside of continental Europe. Rather than solely placing the ES concept in the overseas policy plans of related EU Member States, the ES concept needs anchoring in national nature conservation and decision-making efforts as well as in local societies and cultures of the overseas regions, countries and territories. Voluntary programmes, such as the BEST initiative, are a step in the right direction. Capacity building amongst relevant stakeholders is required to transfer the ES concept from science into practice.
Concluding remarks: moving forward
Our review shows that current efforts from within the regions as well as from the European Commission to strengthen MAES in ORs and OCTs are still scarce. Nonetheless, general scientific literature on ES mapping and assessment is growing. The NetBiome and EU-BEST projects mark a good beginning with their regional reports of ecosystem profiles and overviews of existing initiatives to protect ES and biodiversity for each region. However, even though there is much information on biodiversity and ecosystems for the seven global regions, a transparent translation into ES maps and assessments still needs to be done. Integrated, standardised ES assessments are often missing and mapping studies often entail scale-mismatches, conducted on global or multi-national scale. Hence, ES mapping and assessment still contribute little to policy and decision-making related to natural resources and conservation management on local or regional scales.
This literature review shows that efforts are still needed for most ORs and OCTs to meet the aims of Action 5 of Target 2 of the EU Biodiversity Strategy 2020. Therefore, we call for the development of a more flexible, guidance-based approach for ES mapping and assessment of EU overseas, including researchers from multiple disciplines and sectors to provide a comprehensive overview of the current status of biodiversity, ecosystems and the services they provide. This requires strong emphasis on MAES from the ORs and OCTs, their related EU Member States as well as from the European Commission. The ESMERALDA project has developed the scientific and methodological background (e.g.
To reach the EU Biodiversity Strategy's target of EU wide, comprehensive maps of ecosystems and their services and the integration of such ES values into national accounting systems by 2020, urgent actions are needed in ORs and OCTs, as overexploitation of natural resources and degradation of habitats through invasive species proceed unaltered. With proceeding climatic change, ES are a suitable tool to promote the protection of coastal habitats and natural protection structures. ES maps can raise awareness, reveal ES supply-demand mismatches and thereby reduce vulnerability of EU overseas areas.
Acknowledgements
This study was funded by the Coordination and Support Action ESMERALDA. This project receives funding from the European Union’s Horizon 2020 research and innovation programme under grant agreement No 642007.
Author contributions
IMS and BB conceived the study. IMS and BB designed the sampling strategy. The literature review was performed by IMS. IMS created the maps and wrote main parts of the paper, with input from all authors. IMS, BB and PAVB contributed to readjustments on previous drafts.
References
- Ecosystem properties, potentials and services – The EPPS conceptual framework and an urban application example.Ecological Indicators21:7‑16. https://doi.org/10.1016/j.ecolind.2011.03.014
- Identification, definition and quantification of goods and services provided by marine biodiversity: Implications for the ecosystem approach.Marine Pollution Bulletin54(3):253‑265. https://doi.org/10.1016/j.marpolbul.2006.12.003
- Limiting abuse: marine protected areas, a limited solution.Ecological Economics31(2):287‑304. https://doi.org/10.1016/s0921-8009(99)00085-3
- Borges PA, Azevedo EB, Borba A, Dinis FO, Gabriel R, Silva E (2009) Ilhas Oceânicas. In: Pereira HM, Domingos T, Vicente L, Proença V (Eds) Ecossistemas e bem-estar humano em Portugal: Avaliação para Portugal do Millennium Ecosystem Assessment.Escolar Editora,Lisboa,463-510pp. [InPortuguese]. URL: http://hdl.handle.net/10400.3/2011
- Cryptotermes brevis(Isoptera: Kalotermitidae) in the Azores: Lessons After 2 yr of Monitoring in the Archipelago.Journal of Insect Science14(1):172. https://doi.org/10.1093/jisesa/ieu034
- Adoption of the ecosystem services concept in EU policies.Ecosystem Services29:213‑222. https://doi.org/10.1016/j.ecoser.2017.02.014
- ESMERALDA Integrated Ecosystem Assessment.One Ecosystem3:e25482. URL: https://doi.org/10.3897/oneeco.3.e25482
- Mapping ecosystem service supply, demand and budgets.Ecological Indicators21:17‑29. https://doi.org/10.1016/j.ecolind.2011.06.019
- Mapping Ecosystem Services.Pensoft[ISBN9789546428295]
- Cerqueira Y, Navarro LM, Maes J, Marta-Pedroso C, Pradinho Honrado J, Pereira H (2015) Ecosystem Services. The Opportunities of Rewilding in Europe. In: Pereira H, Navarro L (Eds) Rewilding European Landscapes.Springer International Publishing,223pp. [ISBN978-3-319-12039-3].
- Review of environmental issues in the pacific region and the role of the pacific regional environment programme. Workshop and symposium on Collaboration for sustainable development of the Pacific Islands: Towards effective e-learning systems on environment.Okinawa, Japan.
- Quantifying and mapping ecosystem services.International Journal of Biodiversity Science, Ecosystem Services & Management8:1‑4. https://doi.org/10.1080/21513732.2012.695229
- A blueprint for mapping and modelling ecosystem services.Ecosystem Services4:4‑14. https://doi.org/10.1016/j.ecoser.2013.02.001
- De Knegt B (2014) Graadmeter Diensten van Natuur; Vraag, aanbod, gebruik en trend van goederenen diensten uit ecosystemen in Nederland. Wettelijke Onderzoekstaken Natuur & Milieu,; Alterra–Wageningen. WOt-technicalreport,13.Alterra,Wageningen,227pp.
- Illegal gold miners in French Guiana: a neglected population with poor health.BMC Public Health18(1):23. https://doi.org/10.1186/s12889-017-4557-4
- A visualization and data-sharing tool for ecosystem service maps: Lessons learnt, challenges and the way forward.Ecosystem Services13:134‑140. https://doi.org/10.1016/j.ecoser.2014.12.002
- Indicators for mapping ecosystem services: a review.JRC Scientific and Policy Reports,Luxembourg: Publications Office of the European Union,113pp. [ISBN978-92-79-25821-3] https://doi.org/10.2788/41823
- Land Management and Ecosystem Services How Collaborative Research Programmes Can Support Better Policies.GAIA - Ecological Perspectives for Science and Society21(1):55‑63. https://doi.org/10.14512/gaia.21.1.14
- Consolidated version of the Treaty on the Functioning of the European Union. In: Official.Journal of the European Union C202(1):195.
- Message from Reunion Island.The European Union and its OverseasEntities: Strategies to counter Climate Change and Biodiversity Loss,Reunion Island,07.-11.06.2008.European Commission,20pp.
- European Commission (2011) Our life insurance, our natural capital: an EU biodiversity strategy to 2020.Communication from the Commission to the European Parliament, the Council, the Economic and Social Committee and the Committee of Regions,Brussels, Belgium,17pp.
- Biology of Invasive Termites: A Worldwide Review.Annual Review of Entomology58(1):455‑474. https://doi.org/10.1146/annurev-ento-120811-153554
- The effectiveness of coral reefs for coastal hazard risk reduction and adaptation.Nature Communications5https://doi.org/10.1038/ncomms4794
- Coastal and marine protected areas as key elements for tourism in small islands.Journal of Coastal Research70:461‑466. https://doi.org/10.2112/si70-078.1
- A global map of coastal recreation values: Results from a spatially explicit meta-analysis.Ecological Economics86:1‑15. https://doi.org/10.1016/j.ecolecon.2012.11.006
- Recreational Scuba Diving In Caribbean Marine Protected Areas: Do The Users Pay?AMBIO: A Journal of the Human Environment32(2):140. https://doi.org/10.1639/0044-7447(2003)032[0140:rsdicm]2.0.co;2
- Potential Distribution and Cost Estimation of the Damage Caused by <I>Cryptotermes brevis</I> (Isoptera: Kalotermitidae) in the Azores.Journal of Economic Entomology107(4):1554‑1562. https://doi.org/10.1603/ec13501
- Haines-Young R, Potschin M (2010) The links between biodiversity, ecosystem services and human well-being. Ecosystem Ecology. https://doi.org/10.1017/cbo9780511750458.007
- Placing marine protected areas onto the ecosystem-based management seascape.Proceedings of the National Academy of Sciences107(43):18312‑18317. https://doi.org/10.1073/pnas.0908503107
- Warming Trends and Bleaching Stress of the World’s Coral Reefs 1985–2012.Scientific Reports6(1). https://doi.org/10.1038/srep38402
- Collapse and recovery of marine fishes.Nature406(6798):882‑885. https://doi.org/10.1038/35022565
- Message from Guadeloupe. https://www.iucn.org/sites/dev/files/import/downloads/message__from_guadeloupe_en__2_.pdf. Accessed on: 2018-2-10.
- Establishing a marine conservation baseline for the insular Caribbean.Marine Policy60:84‑97. https://doi.org/10.1016/j.marpol.2015.05.005
- The Application of EU Law in the EU’s Overseas Regions, Countries, and Territories After the Entry into Force of The Treaty of Lisbon.International Law Review20(3):269‑743. URL: https://digitalcommons.law.msu.edu/ilr/vol20/iss3/1
- Ecosystem service mapping and assessment gaps in EU member states and recommendations to overcome them.Deliverable 2.2.,EU Horizon 2020 ESMERALDA Project, Grant agreement No. 642007.41pp.
- The Future of Ecosystem Services in Asia and the Pacific.Asia & the Pacific Policy Studies3(3):389‑404. https://doi.org/10.1002/app5.147
- The complete history of salmonid introductions in the Kerguelen Islands, Southern Ocean.Polar Biology36(4):457‑475. https://doi.org/10.1007/s00300-012-1281-5
- Leenhardt P, Low N, Pascal N, Micheli F, Claudet J (2015) The Role of Marine Protected Areas in Providing Ecosystem Services. Aquatic Functional Biodiversity. https://doi.org/10.1016/b978-0-12-417015-5.00009-8
- Global mapping and estimation of ecosystem services values and gross domestic product: A spatially explicit integration of national ‘green GDP’ accounting.Ecological Indicators46:293‑314. https://doi.org/10.1016/j.ecolind.2014.05.020
- Current Status and Future Prospects for the Assessment of Marine and Coastal Ecosystem Services: A Systematic Review.PLoS ONE8(7):e67737. https://doi.org/10.1371/journal.pone.0067737
- Mapping and Assessment of Ecosystems and their Services – An analytical framework for ecosystem assessments under Action 5 of the EU Biodiversity Strategy to 2020. Discussion paper.Publications Office of the European Union[ISBN978-92-79-29369-6] https://doi.org/10.2779/12398
- An indicator framework for assessing ecosystem services in support of the EU Biodiversity Strategy to 2020.Ecosystem Services17:14‑23. https://doi.org/10.1016/j.ecoser.2015.10.023
- Mapping ecosystem services across scales and continents – A review.Ecosystem Services13:57‑63. https://doi.org/10.1016/j.ecoser.2015.01.006
- Methods for mapping ecosystem service supply: a review.International Journal of Biodiversity Science, Ecosystem Services & Management8:17‑25. https://doi.org/10.1080/21513732.2012.663792
- Ecosystems and Human Well-Being: Current State and Trends.Millennium Ecosystem Assessment,948pp. [ISBN9781559632270]
- Cadre conceptuel et glossaire. L’Évaluation Française des Écosystèmes et des Services Écosystémiques (EFESE).[MEDDE].
- Nature Policy Plan - The Caribbean Netherlands 2013-2017.Ministerie van Economische Zaken, Directie Natuur en Biodiversiteit,54pp. URL: https://www.government.nl/documents/publications/2014/02/03/nature-policy-plan-the-caribbean-netherlands
- Preferred Reporting Items for Systematic Reviews and Meta-Analyses: The PRISMA Statement.Annals of Internal Medicine151(4):264. https://doi.org/10.7326/0003-4819-151-4-200908180-00135
- Development of a systematic classification scheme of marine habitats to facilitate regional management and mapping of Caribbean coral reefs.Biological Conservation88(2):155‑163. https://doi.org/10.1016/s0006-3207(98)00108-6
- The value of open ocean ecosystems: A case study for the Spanish exclusive economic zone.Natural Resources Forum35(2):122‑133. https://doi.org/10.1111/j.1477-8947.2011.01383.x
- Nunes PA, Ghermandi A, Onofri L (2014) Guidance manual on valuation and accounting of ecosystem services for small island developing states.UNEP, EcosystemServices Economics Unit, Division of Environmental Policy Implementation,128pp. [ISBN978-92-807-3407-2].
- Rewilding European Landscapes.Springer International Publishing,Cham.
- Portugal Millennium Ecosystem Assessment: State of the Assessment Report.Centro de Biologia Ambiental, Faculdade de Ciências da Universidade de Lisboa.URL: http://ecossistemas.org
- Climate Change and Biodiversity in the European Union Overseas Entities.IUCN,Gland, Switzerland and Brussels, Belgium.,192pp.
- Pollination services mapping and economic valuation from insect communities: a case study in the Azores (Terceira Island).Nature Conservation18:1‑25. https://doi.org/10.3897/natureconservation.18.11523
- Impact of land-use change on flower-visiting insect communities on an oceanic island.Insect Conservation and Diversity10(3):211‑223. https://doi.org/10.1111/icad.12216
- Ecosystem services values in Spain: A meta-analysis.Environmental Science & Policy55:186‑195. https://doi.org/10.1016/j.envsci.2015.10.001
- Functional traits of indigenous and exotic ground-dwelling arthropods show contrasting responses to land-use change in an oceanic island, Terceira, Azores.Diversity and Distributions24(1):36‑47. https://doi.org/10.1111/ddi.12655
- User fees across ecosystem boundaries: Are SCUBA divers willing to pay for terrestrial biodiversity conservation?Journal of Environmental Management200:53‑59. https://doi.org/10.1016/j.jenvman.2017.05.070
- Marine and Coastal Cultural Ecosystem Services: knowledge gaps and research priorities.One Ecosystem2:e12290. https://doi.org/10.3897/oneeco.2.e12290
- Christchurch, N.Z: Gateway Antarctica, Centre for Antarctic Studies and Research, University of Canterbury (Gateway Antarctica special publication series, no. 0801).Research, University of Canterbury (Gateway
- Socio-Economic Benefits of the EU Marine Protected Areas.Report prepared by the Institute for European Environmental Policy (IEEP) for DG Environment,96pp.
- Spanish National Ecosystem Assessment: Socio-economic valuation of ecosystem services in Spain. Synthesis of key findings.Biodiversity Foundation of the Spanish Ministry of Agriculture, Food and Environment.,Madrid, Spain,68pp. [ISBN978-84-608-8776-8]
- Schep S, Johnson A, Beukering P, Esther Wolfs (2012) The fishery value of coral reefs in Bonaire. IVM Institute for Enironmental Studies.The Netherlands
- Microbial bioindicators of soil functioning after disturbance: The case of gold mining in tropical rainforests of French Guiana.Ecological Indicators20:34‑41. https://doi.org/10.1016/j.ecolind.2012.01.021
- National Ecosystem Assessments in Europe: A Review.BioScience66(10):813‑828. https://doi.org/10.1093/biosci/biw101
- Invasive terrestrial flora & fauna of Macaronesia. TOP 100 in Azores, Madeira and Canaries.ARENA,Ponta Delgada. URL: https://repositorio.uac.pt/handle/10400.3/1978 [ISBN978-989-95910-1-1]
- Slootweg R, Van Beukering PJH (2008) Valuation of ecosystem services and strategic environmental assessment-Lessons from influential cases. In: Slootweg R,, Rajvanshi A,, Mathur VB, Kolhoff A (Eds) Biodiversity in environmental assessment: enhancing ecosystem services for human well-being.Cambridge University Press.
- The real wealth of nations: Mapping and monetizing the human ecological footprint.Ecological Indicators16:11‑22. https://doi.org/10.1016/j.ecolind.2011.03.008
- Indicators for a nationwide monitoring of ecosystem services in Germany exemplified by the mitigation of soil erosion by water.Ecological Indicatorshttps://doi.org/10.1016/j.ecolind.2017.05.035
- Expert Group on Green and Circular Economy in the Outermost Regions: Final Report.For DG Regional and Urban Policy, European Commission.,30pp.
- Combining participatory and socioeconomic approaches to map fishing effort in small-scale fisheries.PLOS ONE12(5):e0176862. https://doi.org/10.1371/journal.pone.0176862
- Biodiversity conservation: Uncertainty in predictions of extinction risk/Effects of changes in climate and land use/Climate change and extinction risk (reply).Nature430(6995). https://doi.org/10.1038/nature02719
- Tieskens KF, Schep SW, van Beukering PJH, van Beek IJM, Wolfs EM (2014) Mapping the economic value of ecosystems on St Eustatius.IVM Institute for Environmental Studies
- UK Overseas Territories Biodiversity Strategy.UK Government Activity. Foreign & Commonwealth Office, Department for Environment, Food & rural Affairs, Department for International Development
- The UK National Ecosystem Assessment: Synthesis of the Key Findings.UNEP-WCMC,Cambridge.
- Sustainable coastal tourism—An integrated planning and management approach.UNEP,Paris.
- Unsworth RK, Jones BL, Cullen-Unsworth L, L.M N (2017) How hurricanes such as Irma and Maria can devastate the Caribbean marine environment. the Conversation UK, 25.09.2017.
- Climate Change Risk Assessment for Plants and Soils of the Falkland Islands and the Services they provide.Royal Botanic Gardens Kew and UK Falkland Islands Trusthttps://doi.org/10.13140/RG.2.2.15660.67203
- van Beukering P, Brouwer R, Schep S, Wolfs E, Brander L, Ebanks-Petrie G, Austin T (2014) The impact of invasive species on tourism.Wolfs Company
- van der Lely JA, van Beukering P,, Muresan L., Zambrano Cortes D,, Wolfs E,, Schep S (2013) The total economic value of nature on Bonaire.IVM Institute for Environmental Studies,Amsterdam.
- Coastal protection by coral reefs: A framework for spatial assessment and economic valuation.Ocean & Coastal Management96:94‑103. https://doi.org/10.1016/j.ocecoaman.2014.05.001
- Verweij P, Debrot D, Meesters E (2015) Identifying indicators to report on the status and trends of biodiversity for the Dutch Caribbean; Indicators, monitoring and assessment methods and capacity estimates. Indicators, monitoring and assessment methods and capacityestimates.2544.Alterra Wageningen UR (University & Research,Wageningen.
- Impact of Biological Invasions on Ecosystem Services.Invading Nature - Springer Series in Invasion Ecology,12.Springer,354pp. [ISBN978-3-319-45121-3]
- Ecological impacts of invasive alien plants: a meta-analysis of their effects on species, communities and ecosystems.Ecology Letters14(7):702‑708. https://doi.org/10.1111/j.1461-0248.2011.01628.x
- Capacity, pressure, demand, and flow: A conceptual framework for analyzing ecosystem service provision and delivery.Ecological Complexity15:114‑121. https://doi.org/10.1016/j.ecocom.2013.07.004
- Use of coastal economic valuation in decision making in the Caribbean: Enabling conditions and lessons learned.Ecosystem Services11:45‑55. https://doi.org/10.1016/j.ecoser.2014.07.010
- Tourism vs Environment. The case for coastal areas.Springer Science & Business Media[ISBN978-94-011-2068-5]
- Wong PP, Moro D, Rhonell J (2005) Island Ecosystems. Millennium Ecosystem Assessment: Ecosystems and Human Well-Being. current State and Trends.
- Impacts of Biodiversity Loss on Ocean Ecosystem Services.Science314(5800):787‑790. https://doi.org/10.1126/science.1132294
- An Ecosystem-Service Approach to Evaluate the Role of Non-Native Species in Urbanized Wetlands.International Journal of Environmental Research and Public Health12(4):3926‑3943. https://doi.org/10.3390/ijerph120403926
Supplementary materials
all studies were conducted between 1991 and 2017 .
e.g. Caribbean (http://campam.gcfi.org/CaribbeanMPA/CaribbeanMPA.php)