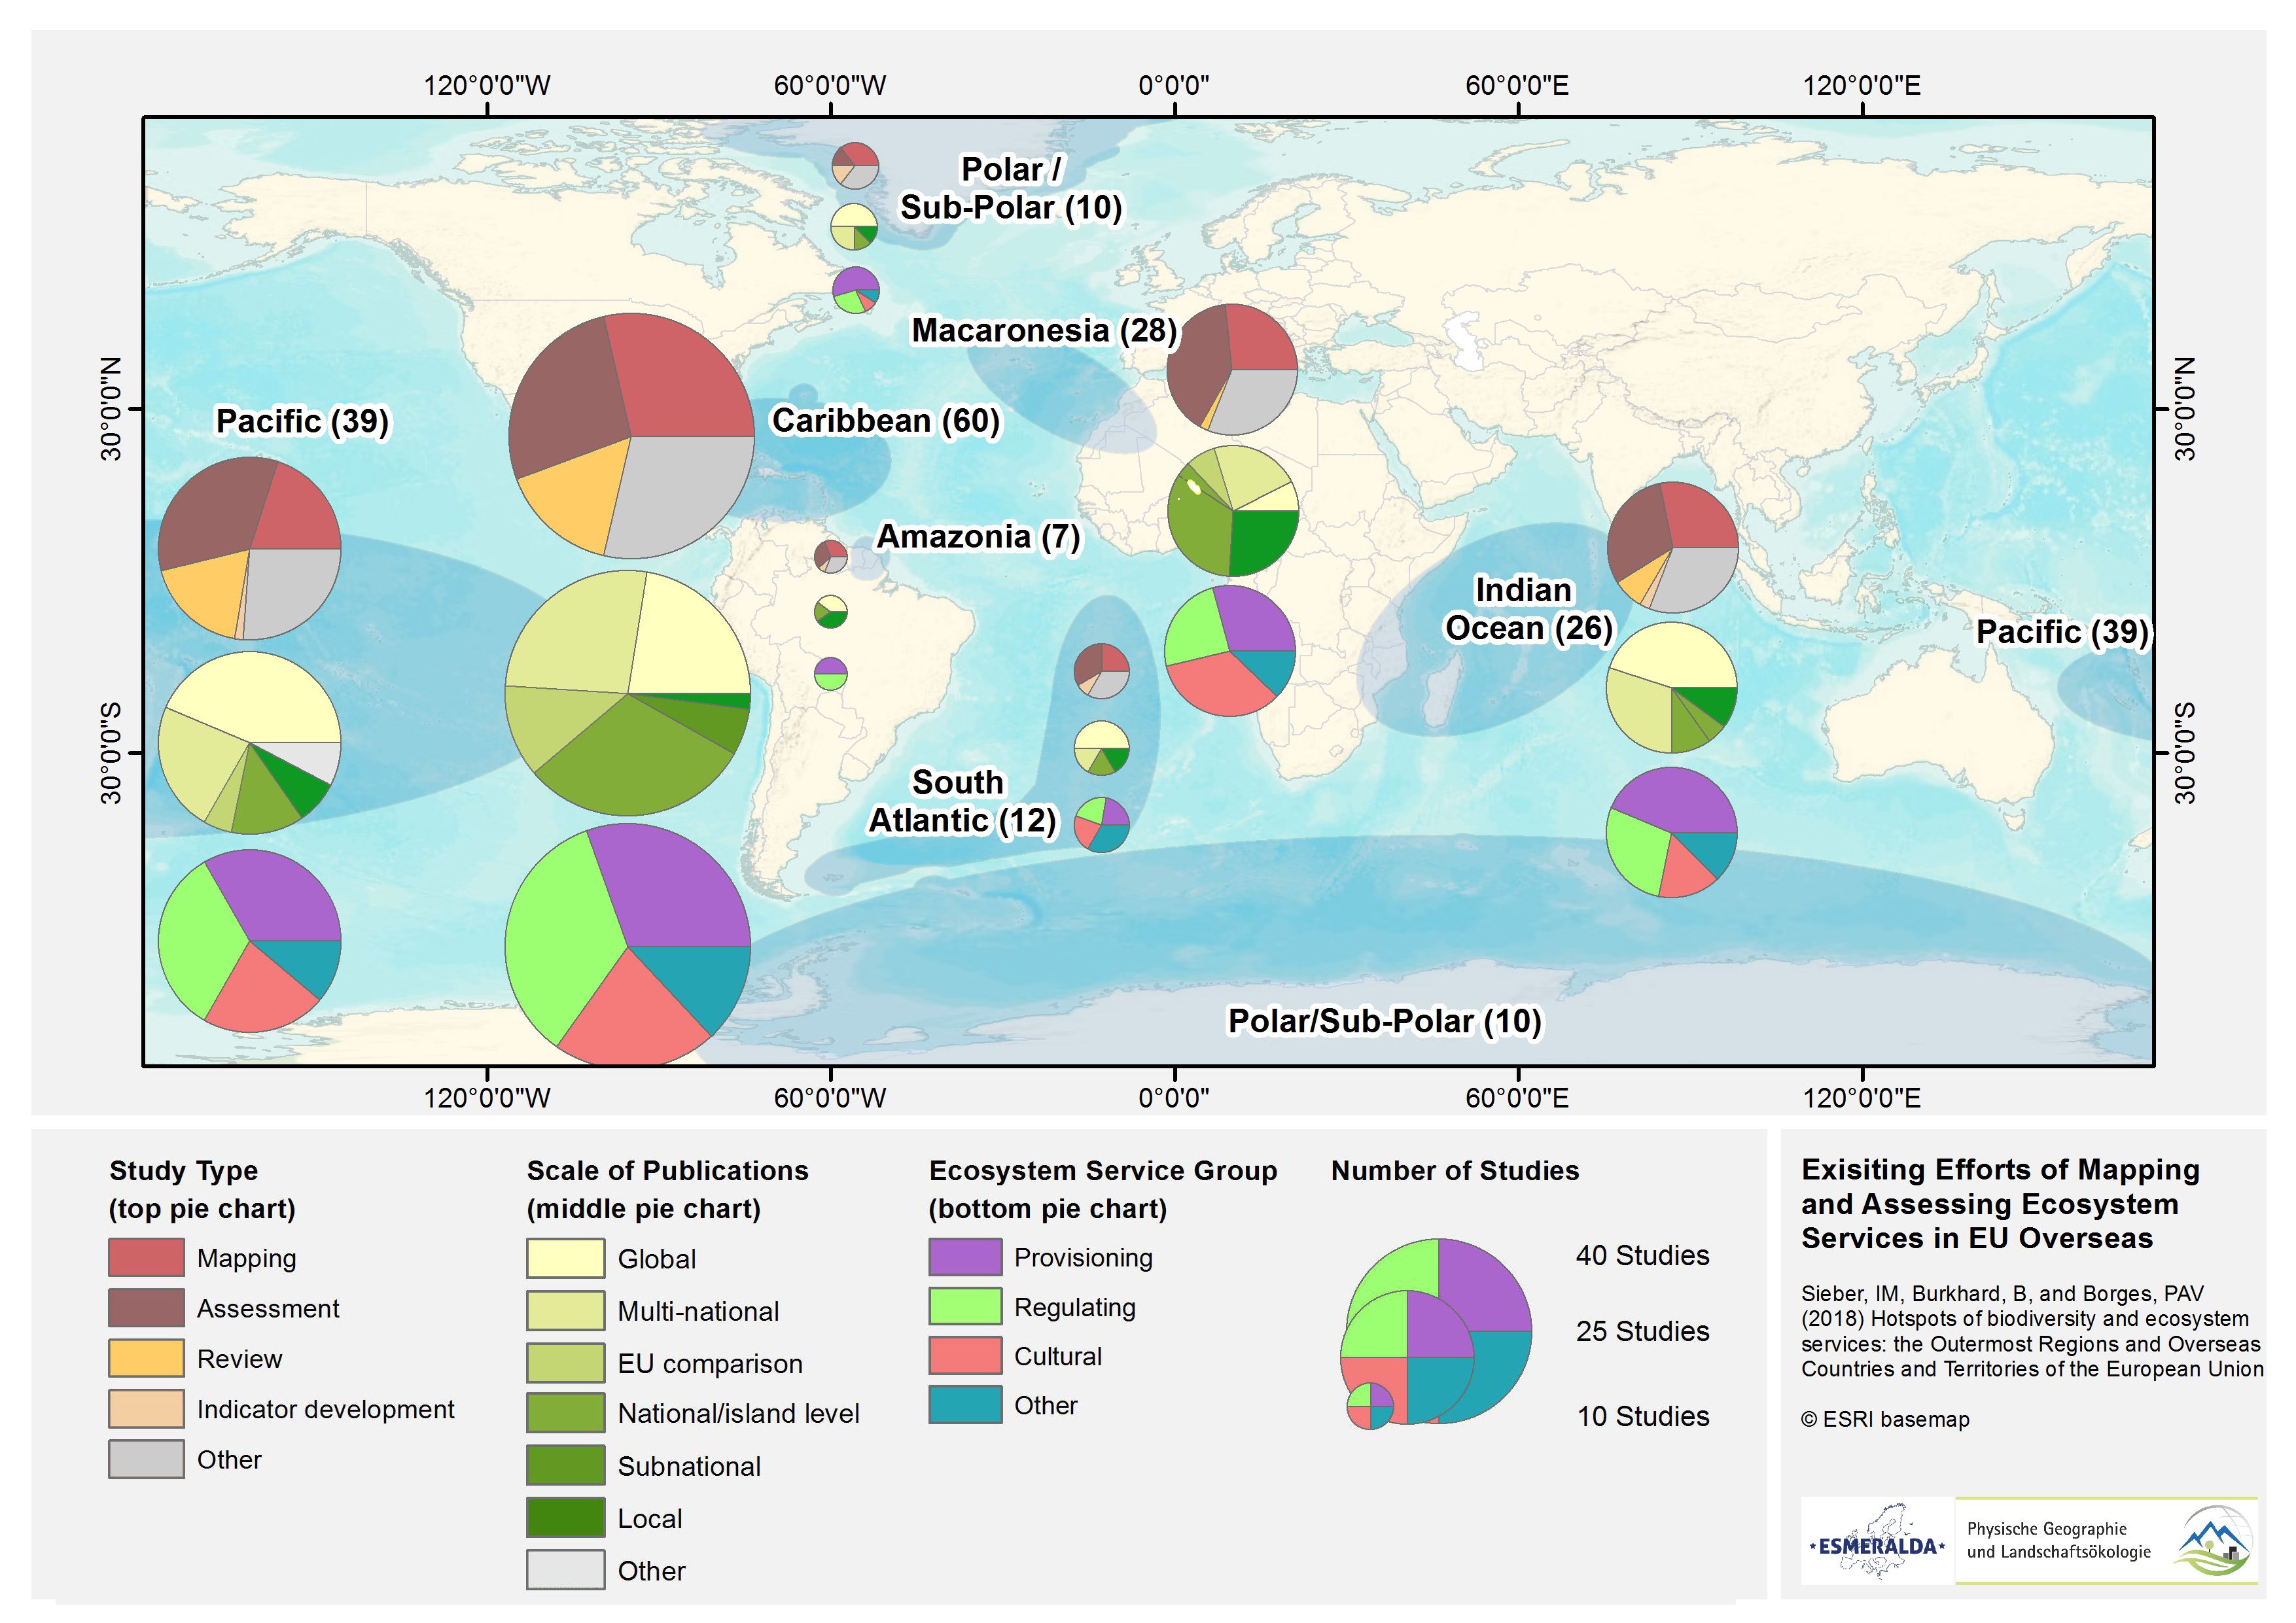
Geographical location of ES mapping and assessment studies in ORs and OCTs. All publications (n=161) obtained between April and June 2017 are included and divided by global regions. The map shows the number of case studies per region (number in brackets), their study type (top pie charts), scale of publication (middle pie charts) and group of ES assessed (bottom pie charts). Assessments at national or larger spatial scales are included in the map.