|
One Ecosystem :
Methods
|
|
Corresponding author: Sara Palomo-Campesino (sara.pal.cam@gmail.com)
Academic editor: Joachim Maes
Received: 15 Feb 2018 | Accepted: 20 Apr 2018 | Published: 02 May 2018
© 2018 Sara Palomo-Campesino, Ignacio Palomo, Javier Moreno, José González
This is an open access article distributed under the terms of the Creative Commons Attribution License (CC BY 4.0), which permits unrestricted use, distribution, and reproduction in any medium, provided the original author and source are credited.
Citation:
Palomo-Campesino S, Palomo I, Moreno J, González J (2018) Characterising the rural-urban gradient through the participatory mapping of ecosystem services: insights for landscape planning. One Ecosystem 3: e24487. https://doi.org/10.3897/oneeco.3.e24487
|
|
Abstract
The application of the ecosystem services (ES) framework in landscape planning has become particularly relevant in rural-urban gradients since it allows for the integration of the complex interactions between ES supply and demand. This framework might be a powerful tool to inform landscape planning and decision-making intended to maintain the current and future flow of ES. In this study, we developed a process of participatory mapping of ES in a rural-urban gradient in southern Spain, which comprises the Sierra Nevada mountain range, the Granada valley and the city of Granada. First, we interviewed 21 key stakeholders from different professional sectors and gradient zones. These stakeholders prioritised nine ES in terms of their importance for local human well-being and their vulnerability to current drivers of change. Then, a workshop was organised in which 23 local actors shared their experience and knowledge regarding ES in the studied landscape. Sorted into five groups (composed of stakeholders with different profiles), the participants spatially mapped the most important supply and demand areas for the nine ES previously prioritised. The results show that the city of Granada has a very high demand for ES and a very low supply, while the Sierra Nevada mountain range and the valley of Granada appear to be very important ES supply areas. According to 95% of the stakeholders that attended the workshop, participatory mapping of ES is a very important (69%) or an important (26%) methodology to elicit the views and perceptions of the population, to identify the main conflicts and potential solutions for the territory and to visualise the high dependence of urban areas on the ES provided by adjacent rural areas. Our results also highlight the importance of incorporating the analysis of ES flows to inform landscape planning at the regional scale. Participatory mapping of ES can enhance decision-making regarding the maintenance of human well-being and the sustainability of social-ecological systems.
Keywords
Ecosystem services, landscape planning, participatory mapping, rural-urban gradient, supply-demand
Introduction
Broadly defined as “the benefits people obtain from ecosystems” (
The ES framework has demonstrated itself to be particularly useful for analysing the dynamics of rural-urban gradients (
In this context, mapping ES can be a useful tool to make rural-urban relationships visible since it allows the integration of complex information through the identification of the main supply and demand areas of ES within the territory (
Further, including participation in ES mapping methodologies largely improves the visibility and awareness of the dependence of society on ecosystems (
In this paper, we aim to uncover the existing relationships between ES supply and demand areas along a rural-urban gradient that comprises the Sierra Nevada mountain range, the Granada valley and the Granada city (southern Spain). By means of a participatory mapping workshop, we explored the existence of differences in the supply and demand of nine ES amongst different land use protection categories, municipality typologies and altitude intervals. Finally, drawing on the evaluation made by the local stakeholders who participated in the process, we analysed the strengths and weaknesses of participatory mapping, providing insights for a new integrated landscape planning model.
Methods
Study area
This study was conducted in a rural-urban gradient in southern Spain that comprises the Alto Genil watershed, including part of the Sierra Nevada mountain range, part of the Granada valley and the city of Granada (Fig.
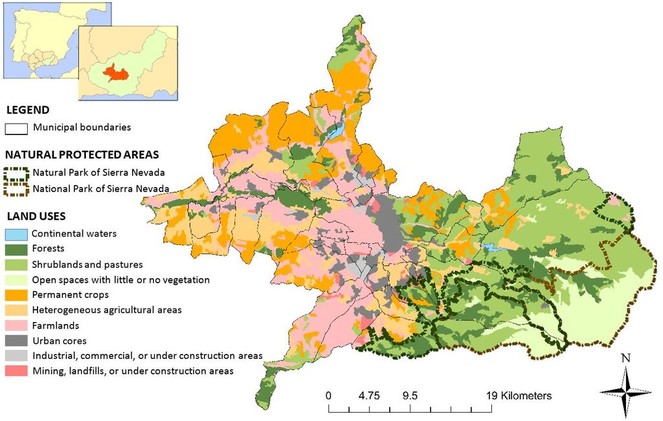
Within the mountain range, two natural protected areas are present: the Sierra Nevada Natural Park, which was designated in 1989 and the Sierra Nevada National Park, which was designated in 1999, with 13,057 and 17,817 hectares respectively. While in the Sierra Nevada National Park, anthropic activities are highly restricted, the Sierra Nevada Natural Park conservation policies are less strict, allowing traditional practices such as livestock raising and important economic activities such as the Sierra Nevada ski resort (
The Granada valley has historically been one of the most productive areas of Spain and directly depends on the Sierra Nevada mountain range water reservoir. There are three remarkable periods in the history of the Granada valley based on the dominant crops: flax and hemp (18th-19th centuries), beetroot (20th century) and tobacco (20th century) (
The city of Granada is the fourth largest town in Andalusia and the sixteenth in Spain with over 230,000 inhabitants. Granada comprises 8,802 hectares, which is only 0.7% of the total surface area of the Province of Granada, but harbours 25.6% of the total population. This, combined with the fact that 30.3% of the population lives in peri-urban municipalities (which comprise 6.1% of the province’s surface area), means that more than one half of the population of the province lives in urban and peri-urban areas. The city of Granada has become a focus of interest for the tourism industry, particularly for its Andalusí history and architecture and the castle of the Alhambra, which drew over 2.5 million tourists in 2016.
Methodological design
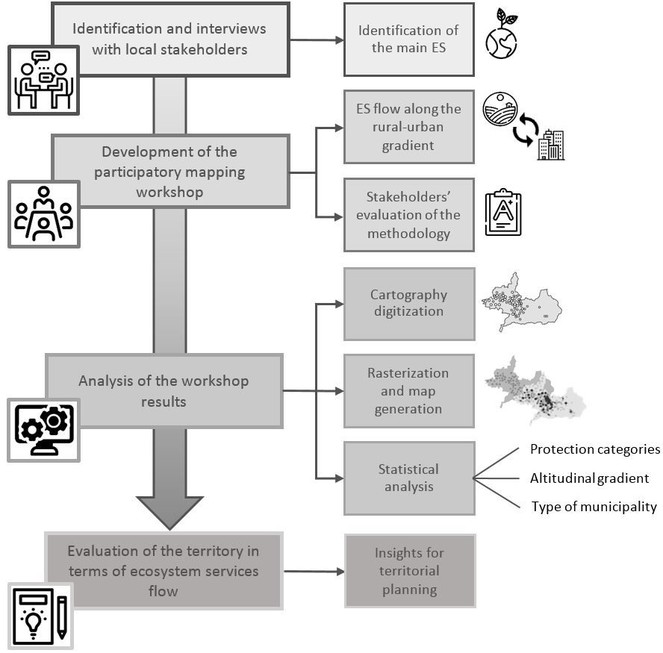
A participatory mapping process was developed to assess the supply and demand of ES within the study area and to identify key elements to be considered in a new integrated landscape planning scheme. First, we identified and interviewed local stakeholders to characterise the most important and vulnerable ES in the area; then, we developed a one-day participatory mapping workshop to identify the main supply and demand areas of ES; and finally, we analysed the results in terms of ES flows (Fig.
Stakeholders' characterisation and ecosystem services' selection
Through consultation with experts, we selected an initial number of stakeholders representing different sectors, closely related to the study area and with sufficient knowledge of the territory to identify the main ES supply and demand areas. This initial list of stakeholders was later enlarged through “snowball sampling” in order to capture the different views and discourses that co-exist in the area. During March and April of 2016, we interviewed a total of 21 local stakeholders who interacted in many different ways with the study area and who belonged to different sectors (farmers, peasants, researchers, businessmen, managers etc.).
The main objectives of those semi-structured interviews were to characterise every stakeholder, to identify the ES that would be mapped in the workshop, to obtain more contacts (snowball sampling) and to build trust with the actors to later invite them to the workshop. For the characterisation, we asked the respondents in which ways they interacted with the different areas of the territory (Sierra Nevada, valley of Granada and the city of Granada) and what kind of activities they usually carried out in those areas. For the ES identification, we first explained to the interviewees the ES concept (introduced to them as the contributions of nature to human well-being) and then we gave them a list of 25 ES of which they had to prioritise the most important ones supplied on each area. Then, from those ES prioritised, the interviewees were asked to select the most vulnerable ones. We created a matrix with the importance and vulnerability given by the interviewees to the 25 ES from the list. This matrix, together with an expert consultation and the stakeholders’ discourses during their interviews, allowed us to prioritise nine ES that would be mapped in the workshop.
Participatory mapping of ecosystem services workshop
The participatory mapping workshop occurred on 20 May 2016. Eleven previously interviewed stakeholders participated in the workshop and another twelve stakeholders were contacted through snowball sampling and invited to the session, making a total of 23 participants (Table
|
Sector |
Gender |
Place of residence |
Workshop group |
|
Traditional irrigation ditches researcher |
Male |
Peri-urban area |
1: valley |
|
Urban planning university teacher |
Male |
Valley |
1: valley |
|
Retiree |
Female |
Peri -urban area |
1: valley |
|
Organic farmer |
Male |
Valley |
1: valley |
|
Architect |
Male |
Valley |
1: valley |
|
Ski resort manager |
Male |
Mountain range |
2: mixed |
|
Ski monitor |
Female |
Peri-urban area |
2: mixed |
|
Organic farmer |
Male |
Mountain range |
2: mixed |
|
Irrigation association |
Male |
Valley |
2: mixed |
|
Livestock researcher |
Male |
City |
3: mountain range |
|
Nature photographer |
Male |
City |
3: mountain range |
|
Sierra Nevada Natural Protected Areas manager |
Female |
Valley |
3: mountain range |
|
Touristic rural house owner |
Male |
Mountain range |
3: mountain range |
|
Farmer |
Male |
Valley |
3: mountain range |
|
Urban architect |
Female |
City |
4: valley |
|
Environmental impact university teacher |
Male |
Valley |
4: valley |
|
Environmental education association |
Male |
City |
4: valley |
|
Retiree |
Female |
Peri-urban area |
4: valley |
|
Geography university teacher |
Male |
City |
4: valley |
|
Ski equipment shop owner |
Female |
City |
5: mountain range |
|
Sierra Nevada Natural Protected Areas tour guide |
Male |
Peri-urban area |
5: mountain range |
|
Organic goat farmer |
Male |
Mountain range |
5: mountain range |
|
Farmer |
Male |
Valley |
5: mountain range |
Before starting the workshop, we explained to all the participants the theoretical framework and objectives of the project as well as the “scientific meaning” of the nine ES selected, the exercises that they would have to carry out and how we would analyse the results after the workshop. When we finished this introduction, we split the participants into five groups of four to five stakeholders according to their identified connections with the study area. Hence, two groups were represented by stakeholders who had stronger connections to the Sierra Nevada mountain range, two groups were represented by stakeholders with stronger connections to the Granada valley and one mixed group was represented by stakeholders with connections to either the Sierra Nevada mountain range and/or the Granada valley (Table
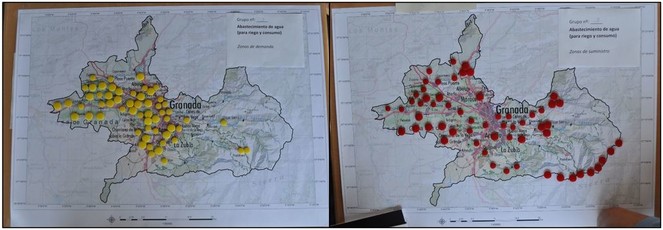
We separated the groups at five different tables and gave them two A1 size maps (1:65,000) of the study area, 60 red plastic dots and 60 yellow plastic dots. For each colour, the groups had 30 large plastic dots (2 cm diameter) and 30 small ones (1 cm diameter), covering a surface in the map of 1.33 and 0.33 km2 respectively. The scale and size of the maps were chosen based on previous experience with this methodology (
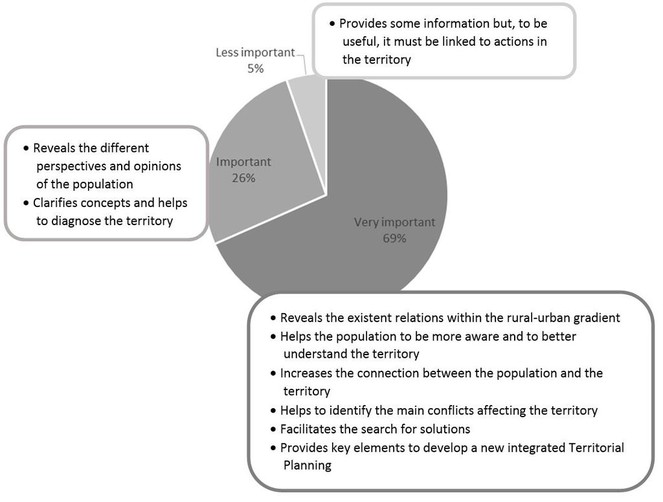
To conclude the workshop, we asked the participants to fill out a brief questionnaire in which they could evaluate the potential role of participatory mapping of ES in landscape planning. We specifically asked the participants to indicate their perceptions about the importance (very important, important, less important or unimportant) of participatory mapping of ES for landscape planning and the reasons why they considered it important or not.
Analysis of the workshop results
The pictures of the maps taken during the workshops were processed with a geographic information system. We created a shapefile for every map and then we rasterised them. With the resulting raster, we elaborated 26 maps: nine maps representing the demand intensity and nine maps representing the supply intensity for each ES (the intensity represents the number of dots placed by the participants in each pixel of the study area, in this case ranging from 0 to 5); three maps representing the demand intensity and three maps representing the supply intensity for each ES typology (the intensity ranged from 0 to 15); and one map representing the total demand intensity and one map representing the total supply intensity for ES (the intensity ranged from 0 to 45). These maps gave us graphical information about the main supply and demand areas for every ES analysed.
Further, we explored the relationship amongst ES supply-demand areas and three different factors: (1) the degree of land protection; (2) the altitudinal gradient; and (3) the type of municipalities. To analyse these relationships, we first created a shapefile for each factor using the Andalusian Multi-Territorial Information System (SIMA) database. The land protection categories shapefile was created including four categories: non-protected areas, urban areas, Sierra Nevada Natural Park and Sierra Nevada National Park. The altitudinal gradient shapefile included 30 altitude intervals of 100 metres, ranging from 500 to 3,400 metres. Finally, to create the shapefile of municipality typologies, we performed a principal component analysis (PCA) and a hierarchical cluster analysis (HCA) to cluster the municipalities based on their differences in 19 socio-demographic and ecological parameters (Suppl. material
For each of the three geographical factors, we created a point shapefile (100 to 200 random points per each factor category with an average density of around 1 point/km2). Then we extracted to these point shapefiles, the information regarding ES supply and demand and the three factors created (land use category, altitude range, municipality typology).
Finally, we tested the effect of the degree of land protection and the type of municipality on ES supply-demand using Kruskal-Wallis tests, with post hoc Dunn’s multiple comparisons. We graphically represented the results with box-and-whisker plots. The effects of the altitudinal gradient was tested with Spearman correlation tests and the results graphically represented with scatter plots.
Results
Ecosystem services prioritisation
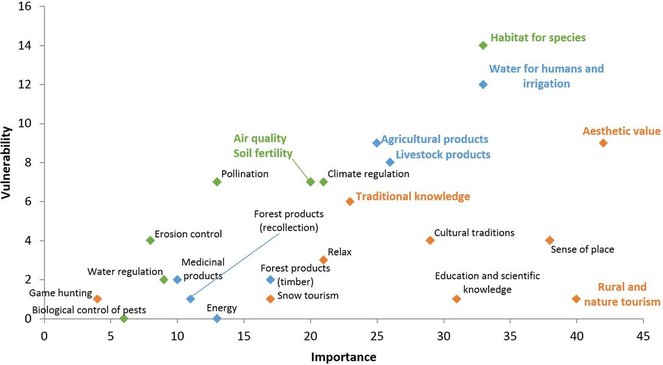
The matrix created from the interviewees' answers allowed us to select three ES from each category based on their importance and vulnerability: water for humans and irrigation, agricultural products and livestock products (provisioning services); habitat for species, air quality and soil fertility (regulating services); and aesthetic value, traditional ecological knowledge and rural and nature tourism (cultural services) (Fig.
Ecosystem services supply and demand areas
Overall, the maps did not reveal a clear pattern of supply areas for each typology of ES. The dots were quite uniformly distributed along the territory, but we found that the density was slightly higher in the Sierra Nevada mountain range and the Granada valley poplar groves. Regarding the results for each ES, (1) the Sierra Nevada mountain range was mainly characterised as a supplier of water, livestock products, habitat for species, tourism and aesthetic values and (2) the Granada valley was mainly characterised as a supplier of agricultural products, soil fertility and traditional ecological knowledge (Fig.
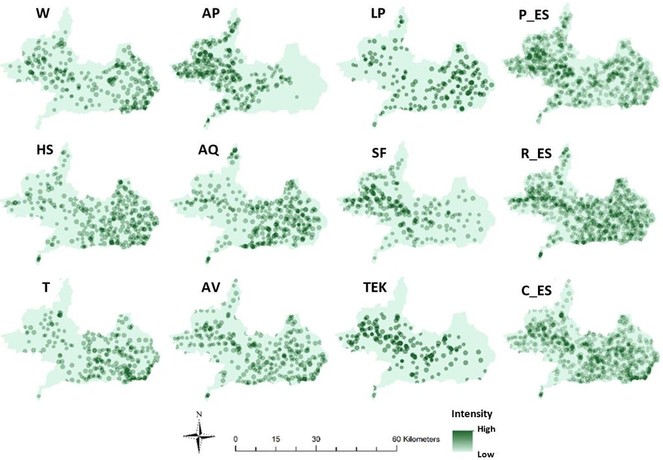
ES supply areas resulting from the workshop. W: water for humans and irrigation; AP: agricultural products; LP: livestock products; P_ES: provisioning services; HS: habitat for species; AQ: air quality; SF: soil fertility; R_ES: regulating services; T: tourism; AV: aesthetic value; TEK: traditional ecological knowledge; C_ES: cultural services.
Maps of ES demand showed more clear spatial patterns. The areas with the highest demand for every ES were Granada city and other peri-urban areas, although demand was lower for soil fertility and traditional ecological knowledge. On the other hand, the services in greatest demand in the Sierra Nevada mountain range were habitat for species and air quality and the services in greatest demand in Granada valley were water for humans and irrigation, air quality and soil fertility (Fig.
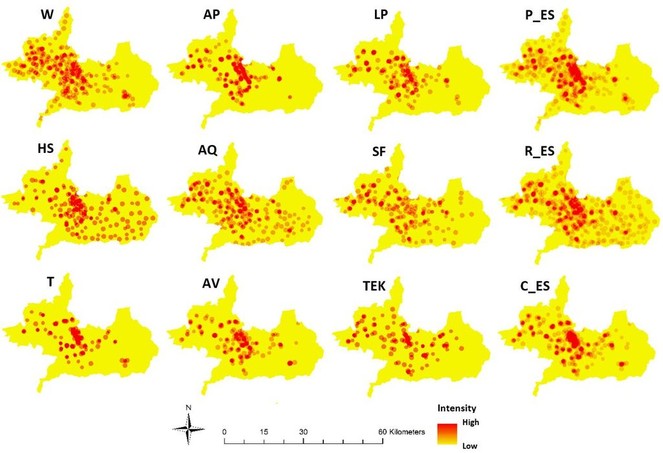
ES demand areas resulting from the workshop: W: water for humans and irrigation; AP: agricultural products; LP: livestock products; P_ES: provisioning services; HS: habitat for species; AQ: air quality; SF: soil fertility; R_ES: regulating services; T: tourism; AV: aesthetic value; TEK: traditional ecological knowledge; C_ES: cultural service.
The participants also identified several other Spanish provinces and European countries where some of the ES supplied in the study area were demanded. Habitat for species, rural and nature tourism, aesthetic value and traditional ecological knowledge were identified as the most demanded ES in other European countries, while rural and nature tourism, aesthetic value and livestock products were identified as the most demanded ES in other areas of Spain.
Land protection categories and ecosystem services flows
There were statistically significant differences in the supply of ES amongst the different land protection categories (Kruskal-Wallis; \(\chi^2\)=100.76; p-value<0.001). ES supply of Sierra Nevada National Park was significantly higher than the supply of non-protected areas and urban areas; Sierra Nevada Natural Park also showed higher supply than urban areas (Dunn’s test, p<0.05). On the other hand, there were no statistically significant differences betweenSierra Nevada Natural Park and non-protected areas and between Sierra Nevada National Park and Sierra Nevada Natural Park. The highest mean supply values corresponded to Sierra Nevada National Park (\(\bar{x}\)=4.80) and Natural Park (\(\bar{x}\)=4.43), followed by non-protected areas (\(\bar{x}\)=4.10) and urban areas (\(\bar{x}\)=2.45) (Fig.
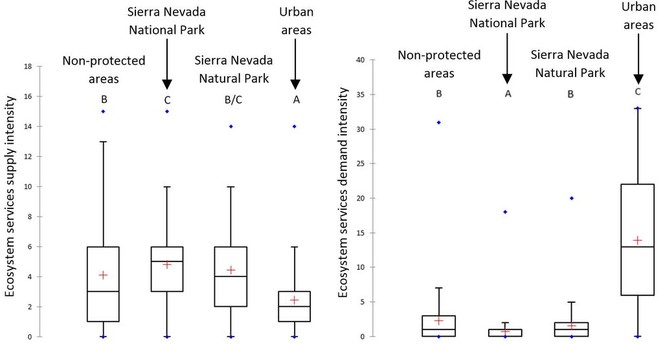
Boxplots of the intensity of ES supply (left) and demand (right) in the different land protection categories of the study area. Capital letters below the name indicate if there is any statistically significant difference between the areas (different letter) or not (same letter) with a significance level of 0.05.
There were also statistically significant differences amongst land protection categories in ES demand (Kruskal-Wallis; \(\chi^2\)=373.66; p-value<0.001). Contrary to the supply results, urban areas had a significantly higher demand, while Sierra Nevada National Park had a significantly lower demand (Dunn’s test, p<0.05). The highest mean demand value corresponded to urban areas (\(\bar{x}\)=13.900), followed by non-protected areas (\(\bar{x}\)=2.30), Sierra Nevada Natural Park (\(\bar{x}\)=1.53) and Sierra Nevada National Park (\(\bar{x}\)=0.76) (Fig.
Altitudinal gradient and ecosystem services flows
There was a significant positive correlation (rs=0.74; p-value<0.001) between ES supply and altitude; the higher the altitude along the gradient, the greater the intensity in the supply of ES. Nonetheless, between 500 and 800 metres altitude, the supply intensity progressively decreases and reaches a minimum at 700 metres. The intensity values between 800 and 2,500 metres altitude remain relatively stable with similar values to those found at 500-600 metres. Between 2,500 and 3,300 metres altitude, the intensity tends to increase again with small oscillations, reaching a maximum at 3,300 metres (Fig.
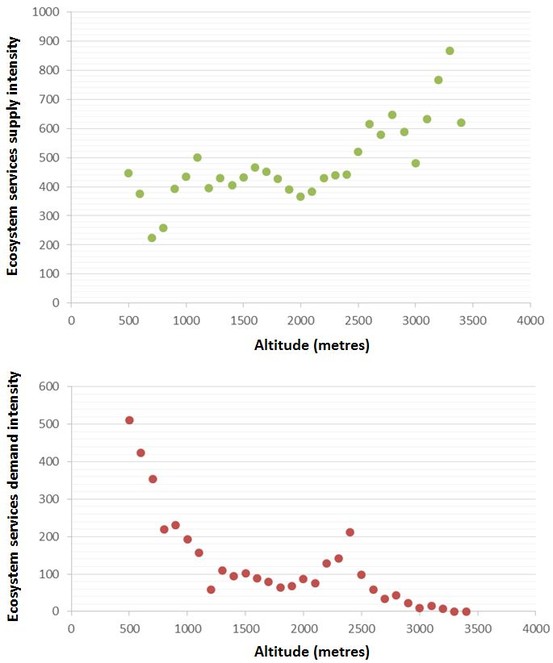
Unlike the results for ES supply, there was a negative correlation (rs=-0.84; p-value<0.001) between ES demand and altitude. In this case, the higher the altitude along the gradient the lower the intensity in ES demand. We found the highest values of demand between 500 and 900 metres altitude, where Granada valley and most of the urban cores are located. Demand values start to decrease from there to the higher areas, until 2,200-2,400 metres altitude, where the Pradollano ski resort is located, creating another important ES demand peak (Fig.
Municipality typology and ecosystem services flows
Four groups of municipalities were clearly distinguished in the study area (HCA dissimilarity coefficient = 60.6) (Suppl. materials
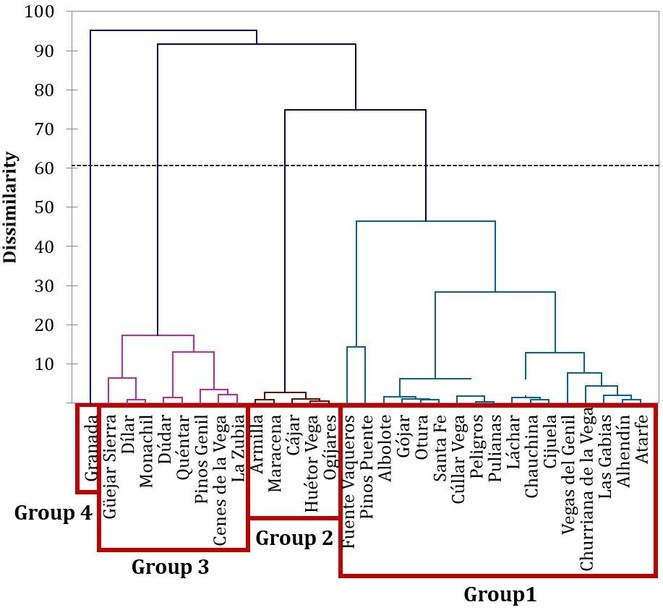
We found statistically significant differences in the supply of ES amongst the four groups of municipalities (Kruskal-Wallis; \(\chi^2\)=134.44; p-value<0.001). Group 1 was significantly different from groups 2, 3 and 4; while group 2 was significantly different from groups 1, 3 and 4; and groups 3 and 4 were significantly different from groups 1 and 2 (Dunn’s test, p-value<0.001). Groups 3 and 4 did not show significant differences between them (Dunn’s test, p-value=0.46) (Fig.
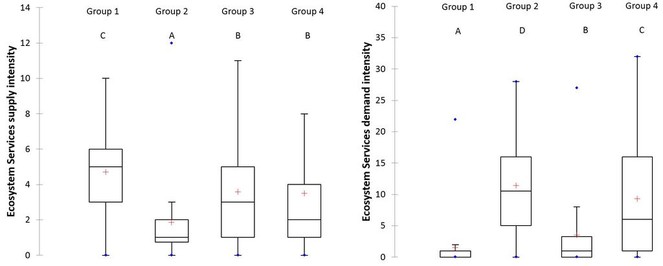
Boxplots of the intensity of ES supply (left) and demand (right) in the four groups of municipalities in the study area. Capital letters below the name indicate if there is any statistically significant difference between the areas (different letter) or not (same letter) with a significance level of 0.05.
We also found statistically significant differences amongst the four groups of municipalities in their demand of ES (Kruskal-Wallis; \(\chi^2\)=281.21; p-value<0.001). Here, every group was significantly different from every other group and the groups with the highest mean demand values were those related to the urban cores, namely, groups 2 (\(\bar{x}\)=11.38) and 4 (\(\bar{x}\)=9.27) (Fig.
Stakeholders’ evaluation
The results of the questionnaires completed after the workshop revealed the perceptions of the stakeholders about the utility and applicability of participatory mapping of ES. As a result, 68.4% of the participants considered this methodology a very important tool to reveal the existing relationships between rural and urban areas. On the other hand, 26.3% of participants considered the process important to reveal and contrast the different perspectives and opinions of the population, as well as to clarify concepts and to provide information about territorial planning. Finally, only one participant thought that the method was not very useful and that, in order to be operative, it should be more closely linked to concrete actions in the territory (Fig.
Discussion
Mapping ecosystem services supply and demand: Insights for landscape planning
This study provides valuable information about ES flows along the rural-urban gradient of the Sierra Nevada mountain range, the Granada valley and the city of Granada. Our participatory mapping exercise revealed that the city of Granada and other peri-urban cores are high demand areas for ES with little supply, while Granada valley and, especially, the Sierra Nevada Natural and National Parks are high supply areas of critical ES. Our analyses also revealed the great importance of the valley as a supply area, especially of agricultural products, soil fertility and traditional ecological knowledge; however, this supply directly depends on the demand of a key ES supplied by the Sierra Nevada mountain range: water for human consumption and for agriculture. Our results are consistent with previous studies that highlight that the growing population and expansion of cities is leading to a growing demand for ES provided elsewhere (
On the local scale, our results are consistent with those of
It seems urgent to include the existing relationships between ES supply and demand within decision-making processes if we take into account the most pressing drivers of change currently affecting our study area: abandonment of agriculture and expansion of urban areas in the Granada valley (
Although many studies have analysed the supply of ES through mapping techniques, few have also integrated the demand to reveal ES flows (
Mapping ES provides information and indicators about the current status and the trends of ES (
Within this framework, the preservation of the flow of ES must be a priority in landscape planning that could be approached through the integration of the participatory mapping of ES in decision-making processes, making it easier to prioritise the actions that are needed in plans or policies affecting the system (
Participatory mapping of ecosystem services: Strengths and limitations
The participatory and deliberative process provided a significant amount of information that reveals some of the strengths and limitations of participatory mapping of ES, some of which have been previously mentioned in literature (Table
Analysis of the strengths, weaknesses, opportunities and threats (SWOT) associated with the participatory mapping of ecosystem services and its potential applications in landscape planning (based on a literature review and the analysis of questionnaires completed by participants in the workshop)
|
Positive |
Negative |
|
|
Internal origin |
Strengths · Provides information about the perception, values and knowledge of the local stakeholders ( · Provides information about the spatial distribution of ecosystem services and the existing mismatches and trade-offs ( · Fosters the exchange of knowledge amongst participants, leading to collective learning ( · Facilitates the identification of existing and potential conflicts affecting the territory ( · Facilitates the mapping of ecosystem services that are difficult to quantify using other methods ( |
Weaknesses · It cannot support determinant decisions by itself regarding landscape planning ( · It has been applied a few times to landscape planning and decision-making ( · It has no practical relevance if it is not linked to actions in the territory · Time, space and human capital are limiting elements for the number of participants and the number of ecosystem services to be mapped |
|
External origin |
Opportunities · Provides useful information to decision-makers to develop evidence-based policies and to prioritise the key elements to include in landscape planning ( · Empowers the local population by including them in the decision-making process, leading to the generation of more trust towards the landscape planning mechanism and associated policies ( · Facilitates the management of conflicts within the territory and the discussion about potential solutions ( · Depending on the results wanted and the available resources, the methodology and development of the workshop can be easily adapted ( |
Threats · During the workshop, conflicts could arise from different opinions or interests amongst the participants ( · Some stakeholders (usually the more powerful ones) are reluctant to get involved in participatory processes, which hinders the results, as their visions and expectations are not reflected in the final maps · The heterogeneity of the participants could influence the resulting maps ( · Some results could lead to the misunderstanding that areas with no relevance for ES supply could be areas where exploitation could be increased ( |
An important limitation that should be acknowledged relates to the necessarily high investment in time and human capital. Participatory workshops require the active involvement of many actors from different sectors and it is not always easy to motivate these actors to participate and to bring them together to discuss these issues. In our case, it took more than three months to establish contact and interview the key stakeholders.
Despite the limitations outlined above, we conclude that including participation in ES mapping greatly helps decision-makers to better value the contribution of ES to human well-being (
Additionally, we consider it necessary to incorporate the participation of citizens in strategic landscape planning. First, because participation fosters a citizenship that is active, organised and aware of the problems that affect their territory and stakeholders can feel that they are part of the planning process (
Conclusions
Mapping ES along the rural-urban gradient of the Sierra Nevada mountain range, the Granada valley and the city of Granada revealed the existence of clear geographic mismatches between the supply and demand of ES. While the Sierra Nevada mountain range and the Granada valley are relevant and interconnected ES supply areas, the city of Granada and the peri-urban areas are huge focuses for ES demand.
Evaluating the flows of ES though participatory mapping and integrating this information in decision-making processes could facilitate the prioritisation of those actions that may be applied in the territory to improve ecosystem sustainability and human well-being. However, it is necessary to combine participatory mapping with other methodologies to provide decision-makers with enough tools to develop new integrated landscape planning schemes that go beyond administrative boundaries. Only by considering the territory as a whole and taking into account where the ES are delivered and where the beneficiaries are located, would it be possible to enhance current policies and management strategies to preserve ecosystem integrity and ensure ES flows.
Acknowledgements
Financial support was provided by the Spanish Ministry of Economy and Competitiveness (project #CGL2014-53782-P, ECOGRADIENTES). Sara Palomo-Campesino was funded by a grant from the Spanish National Institute for Agriculture and Food Research and Technology, co-funded by the Social European Fund (FPI-INIA). We acknowledge all interviewees and participants of the workshop for their time and knowledge. We also thank Juanita Aldana-Domínguez, César A. López Santiago, Alberto Matarán Ruiz and Pamela Zúñiga-Upegui for field assistance.
References
- La repoblación forestal en la vertiente norte de Sierra Nevada.Cuadernos Geográficos de la Universidad de Granada11:283‑306.
- Spatial dynamics of ecosystem service flows: A comprehensive approach to quantifying actual services.Ecosystem Services4:117‑125. https://doi.org/10.1016/j.ecoser.2012.07.012
- Mapping ecosystem service capacity, flow and demand for landscape and urban planning: A case study in the Barcelona metropolitan region.Land Use Policy57:405‑417. https://doi.org/10.1016/j.landusepol.2016.06.006
- (Dis) integrated valuation – Assessing the information gaps in ecosystem service appraisals for governance support.Ecosystem Serviceshttps://doi.org/10.1016/j.ecoser.2017.10.021
- Ecosystem services and emergent vulnerability in managed ecosystems: A geospatial decision-support tool.Ecosystems11(6):923‑938. https://doi.org/10.1007/s10021-008-9170-z
- Measuring change in place values using public participation GIS.(PPGIS). Applied Geography34:316‑324. https://doi.org/10.1016/j.apgeog.2011.12.007
- Public participation GIS: A method for identifying ecosystem services.Society & Natural Resources: An International Journal25(7):633‑651. https://doi.org/10.1080/08941920.2011.621511
- Key issues and research priorities for public participation GIS (PPGIS): A synthesis based on empirical research.Applied Geography46:122‑136. https://doi.org/10.1016/j.apgeog.2013.11.004
- Empirical PPGIS/PGIS mapping of ecosystem services: A review and evaluation.Ecosystem Services13:119‑133. https://doi.org/10.1016/j.ecoser.2014.10.007
- The macroecology of sustainability.PLoS Biology10(6):e1001345. https://doi.org/10.1371/journal.pbio.1001345
- Mapping ecosystem service supply, demand and budgets.Ecological Indicators21:17‑29. https://doi.org/10.1016/j.ecolind.2011.06.019
- Mapping and modelling ecosystem services for science, policy and practice.Ecosystem Services4:1‑3. https://doi.org/10.1016/j.ecoser.2013.04.005
- Ecosystem Service Potentials, Flows and Demands – Concepts for Spatial Localisation, Indication and Quantification.Landscape Online1‑32. https://doi.org/10.3097/lo.201434
- Applying Public Participation Geographic Information Systems to wildlife management.Human Dimensions of Wildlife: An International Journal19(2):200‑214. https://doi.org/10.1080/10871209.2014.871663
- Land science contributions to ecosystem services.Current Opinion in Environmental Sustainability5:509‑514. https://doi.org/10.1016/j.cosust.2013.06.003
- A blueprint for mapping and modelling ecosystem services.Ecosystem Services4:4‑14. https://doi.org/10.1016/j.ecoser.2013.02.001
- Mapping ecosystem services for planning and management.Agriculture, Ecosystems and Environment127:135‑140. https://doi.org/10.1016/j.agee.2008.03.013
- Community stakeholders’ knowledge in landscapes assessments-Mapping indicators for landscape services.Ecological Indicators18:421‑433. https://doi.org/10.1016/j.ecolind.2011.12.004
- Landscape characterization integrating expert and local spatial knowledge of land and forest resources.Environmental Management52:660‑682. https://doi.org/10.1007/s00267-013-0121-x
- Mapping forest ecosystem services: From providing units to beneficiaries.Ecosystem Services4:126‑138. https://doi.org/10.1016/j.ecoser.2013.03.003
- Collaborative mapping of ecosystem services: The role of stakeholders profiles.Ecosystem Services13:141‑152. https://doi.org/10.1016/j.ecoser.2014.11.006
- Classifying and valuing ecosystem services for urban planning.Ecological Economics86:235‑245. https://doi.org/10.1016/j.ecolecon.2012.08.019
- Natural capital and ecosystem services informing decisions: From promise to practice.Proceedings of the National Academy of Sciences112(24):7348‑7355. https://doi.org/10.1073/pnas.1503751112
- Ecosystem services: Foundations for a new rural-urban concept.Ecological Economics62:383‑387. https://doi.org/10.1016/j.ecolecon.2007.02.027
- “Maps have an air of authority”: Potential benefits and challenges of ecosystem service maps at different levels of decision making.Ecosystem Services4:25‑32. https://doi.org/10.1016/j.ecoser.2012.11.003
- Good practices in participatory mapping. https://www.ifad.org/documents/10180/d1383979-4976-4c8e-ba5d-53419e37cbcc
- Decreto 238/2011, de 12 de julio, por el que se establece la ordenación y gestión de Sierra Nevada. https://www.juntadeandalucia.es/medioambiente/web/aplicaciones/Normativa/ficheros/decreto%20orden.%20s.nevada.pdf
- Navigating coastal values: Participatory mapping of ecosystem services for spatial planning.Ecological Economics82:104‑113. https://doi.org/10.1016/j.ecolecon.2012.07.008
- Rural-urban gradient analysis of ecosystem services supply and demand dynamics.Land Use Policy29:521‑535. https://doi.org/10.1016/j.landusepol.2011.07.008
- Systems integration for global sustainability.Science347(6225):1258832. https://doi.org/10.1126/science.1258832
- Mapping ecosystem services for policy support and decision making in the European Union.Ecosystem Services1:31‑39. https://doi.org/10.1016/j.ecoser.2012.06.004
- Ecosystems and Human Well-being: Synthesis. https://www.millenniumassessment.org/documents/document.356.aspx.pdf
- La participación ciudadana en la ordenación del territorio: posibilidades y limitaciones.Cuadernos Geográficos [online]URL: http://www.redalyc.org/articulo.oa?id=17118691003
- Uncovering ecosystem service bundles through social preferences.PLoS ONE7(6):38970. https://doi.org/10.1371/journal.pone.0038970
- Transformaciones recientes en la organización territorial de la Vega de Granada: Del espacio agrario tradicional a la aglomeración urbana actual.Estudios Regionales48:189‑214.
- Reflexiones en torno a los modelos productivista y postproductivista en la Vega de Granada.Cuadernos Geográficos30:415‑427.
- Incorporating ecosystem services into ecosystem-based management to deal with complexity: A participative mental model approach.Landscape Ecology29:1407‑1421. https://doi.org/10.1007/s10980-014-0053-8
- Mapping recreation and ecotourism as a cultural ecosystem services: An application at the local level in Southern Chile.Applied Geography40:71‑82. https://doi.org/10.1016/j.apgeog.2012.12.004
- Flood regulating ecosystem services: Mapping supply and demand in the Etropole municipality, Bulgaria.Ecological Indicators21:67‑79. https://doi.org/10.1016/j.ecolind.2011.06.022
- Land use changes and carbon sequestration through the twentieth century in a Mediterranean mountain ecosystem: Implications for land management.Journal of Environmental Management91:2688‑2695. https://doi.org/10.1016/j.jenvman.2010.07.031
- National Parks, buffer zones and surrounding lands: Mapping ecosystem service flows.Ecosystem Services4:104‑116. https://doi.org/10.1016/j.ecoser.2012.09.001
- Deliberative mapping of ecosystem services within and around Doñana National Park (SW Spain) in relation to land use.Regional Environmental Change14:237‑251. https://doi.org/10.1007/s10113-013-0488-5
- Incorporating the social-ecological approach in protected areas in the Anthropocene.BioScience64:181‑191. https://doi.org/10.1093/biosci/bit033
- Climate change impacts on ecosystem services in high mountain areas: A literature review.Mountain Research and Development37(2):179‑187. https://doi.org/10.1659/MRD-JOURNAL-D-16-00110.1
- Off-stage ecosystem service burdens: A blind spot for global sustainability.Environmental Research Letters12(7):075001. https://doi.org/10.1088/1748-9326/aa7392
- Valuing nature’s contributions to people: the IPBES approach.Current Opinion in Environmental Sustainability7‑16. https://doi.org/10.1016/j.cosust.2016.12.006
- Assessing, mapping, and quantifying cultural ecosystem services at community level.Land Use Policy33:118‑129. https://doi.org/10.1016/j.landusepol.2012.12.013
- Changes in the value of ecosystem services along rural-urban gradient: A case study of Greater Manchester, UK.Landscapes and Urban Planning109:117‑127. https://doi.org/10.1016/j.landurbplan.2012.10.007
- Mapping community values for natural capital and ecosystem services.Ecological Economics68:1301‑1315. https://doi.org/10.1016/j.ecolecon.2008.12.006
- Multiple ecosystem services landscape index: A tool for multifunctional landscapes conservation.Journal of Environmental Management147:152‑163. https://doi.org/10.1016/j.jenvman.2014.09.001
- Notes from the field: Lessons learned from using ecosystem service approaches to inform real-world decisions.Ecological Economics115:11‑21. https://doi.org/10.1016/j.ecolecon.2013.07.009
- Ruiz JF (2017) Gestión del agua y resiliencia en los sistemas de riego tradicionales. Una comparativa socio-ecológica entre los agroecosistemas del sureste español y los de México central.Universidad de GranadaURL: http://0-hera.ugr.es.adrastea.ugr.es/tesisugr/26764155.pdf
- Institutional challenges in putting ecosystem service knowledge in practice.Ecosystem Serviceshttps://doi.org/10.1016/j.ecoser.2017.07.019
- Ten principles for a landscape approach to reconciling agriculture, conservation, and other competing land uses.Proceedings of the National Academy of Sciences110(21):8349‑8356. https://doi.org/10.1073/pnas.1210595110
- Extinction of experience: the loss of human-nature interactions.Frontiers in Ecology and the Environment14(2):94‑101. https://doi.org/10.1002/fee.1225
- Rural-urban differences in life satisfaction: Evidence from the European Union.Regional Studies48(9):1451‑1466. https://doi.org/10.1080/00343404.2012.753142
- Spatial indicators for the assessment of ecosystem services: Providing, benefiting and connecting areas and landscape metrics.Ecological Indicators21:80‑88. https://doi.org/10.1016/j.ecolind.2012.02.013
- Assessing community values to support mapping of ecosystem services in the Koshi river basin, Nepal.Ecosystem Services13:70‑80. https://doi.org/10.1016/j.ecoser.2014.11.004
- Mapping outdoor recreationists’ perceived social values for ecosystem services at Hinchinbrook Island National Park, Australia.Applied Geography35:164‑173. https://doi.org/10.1016/j.apgeog.2012.06.008
- El espacio metropolitano de Granada: De lo rural a lo urbano.Espacios Rurais e Sociedades Campesiñas9:17‑36.
- Mapping ecosystem services demand: A review of current research and future perspectives.Ecological Indicators55:159‑171. https://doi.org/10.1016/j.ecolind.2015.03.016
- Using ecosystem service bundles to detect trade-offs and synergies across urban-rural complexes.Landscape and Urban Planning136:110‑12. https://doi.org/10.1016/j.landurbplan.2014.12.006
Supplementary materials
List of the 19 socio-demographic and ecological parameters used for the study area clustering and their values for each municipality of the study area.
Eigenvalue, percentage of explained variablity and accumulated percentage of explained variability of the five factors (with an eingenvalue higher than 1) result of the PCA analysis and used for the HCA analysis.
Factors' loadings for each of the 19 socio-demographic and ecological variables analysed. Values in bold are statistically significant at P>0.05.