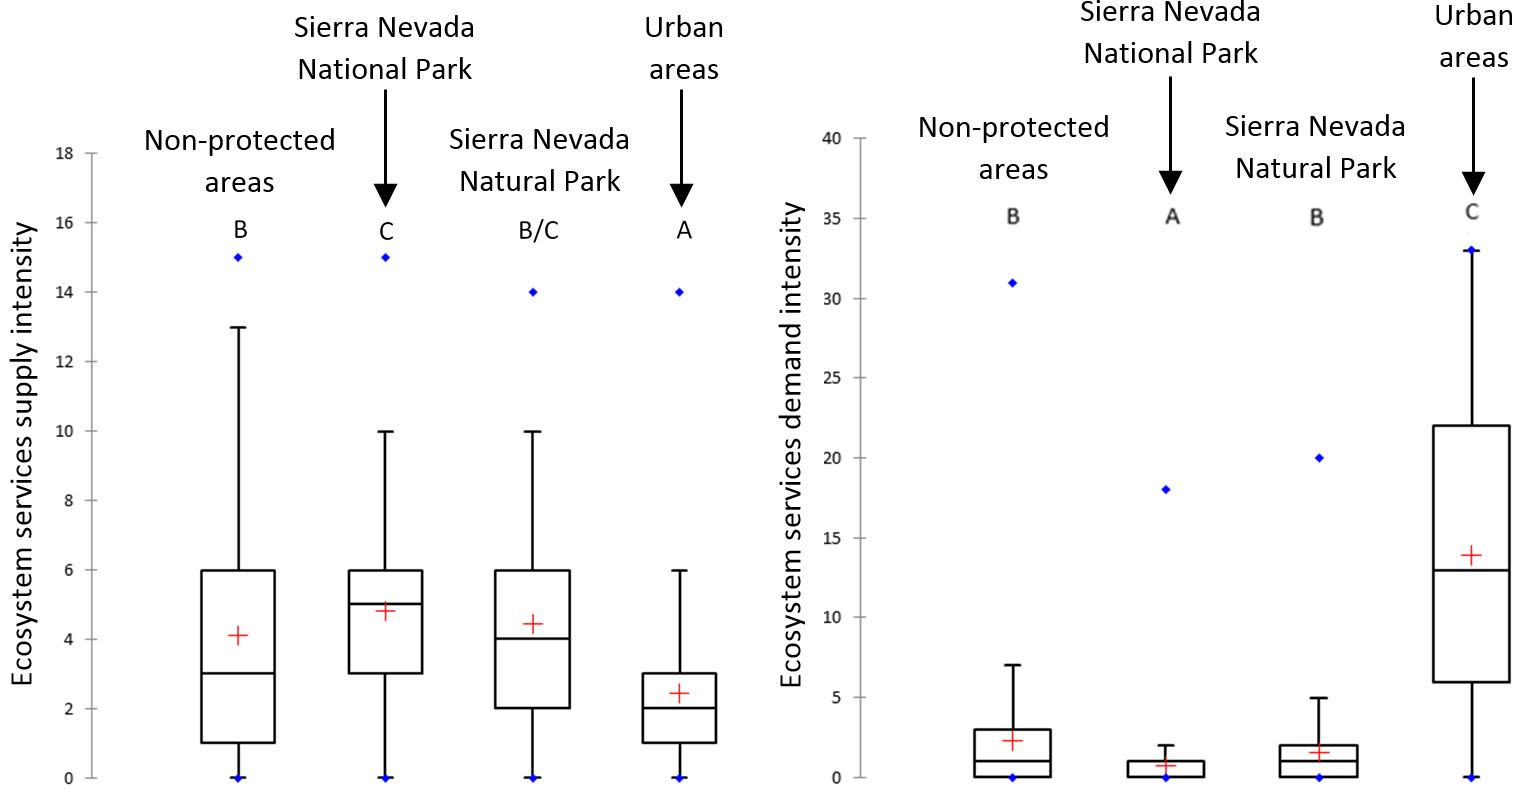
Boxplots of the intensity of ES supply (left) and demand (right) in the different land protection categories of the study area. Capital letters below the name indicate if there is any statistically significant difference between the areas (different letter) or not (same letter) with a significance level of 0.05.