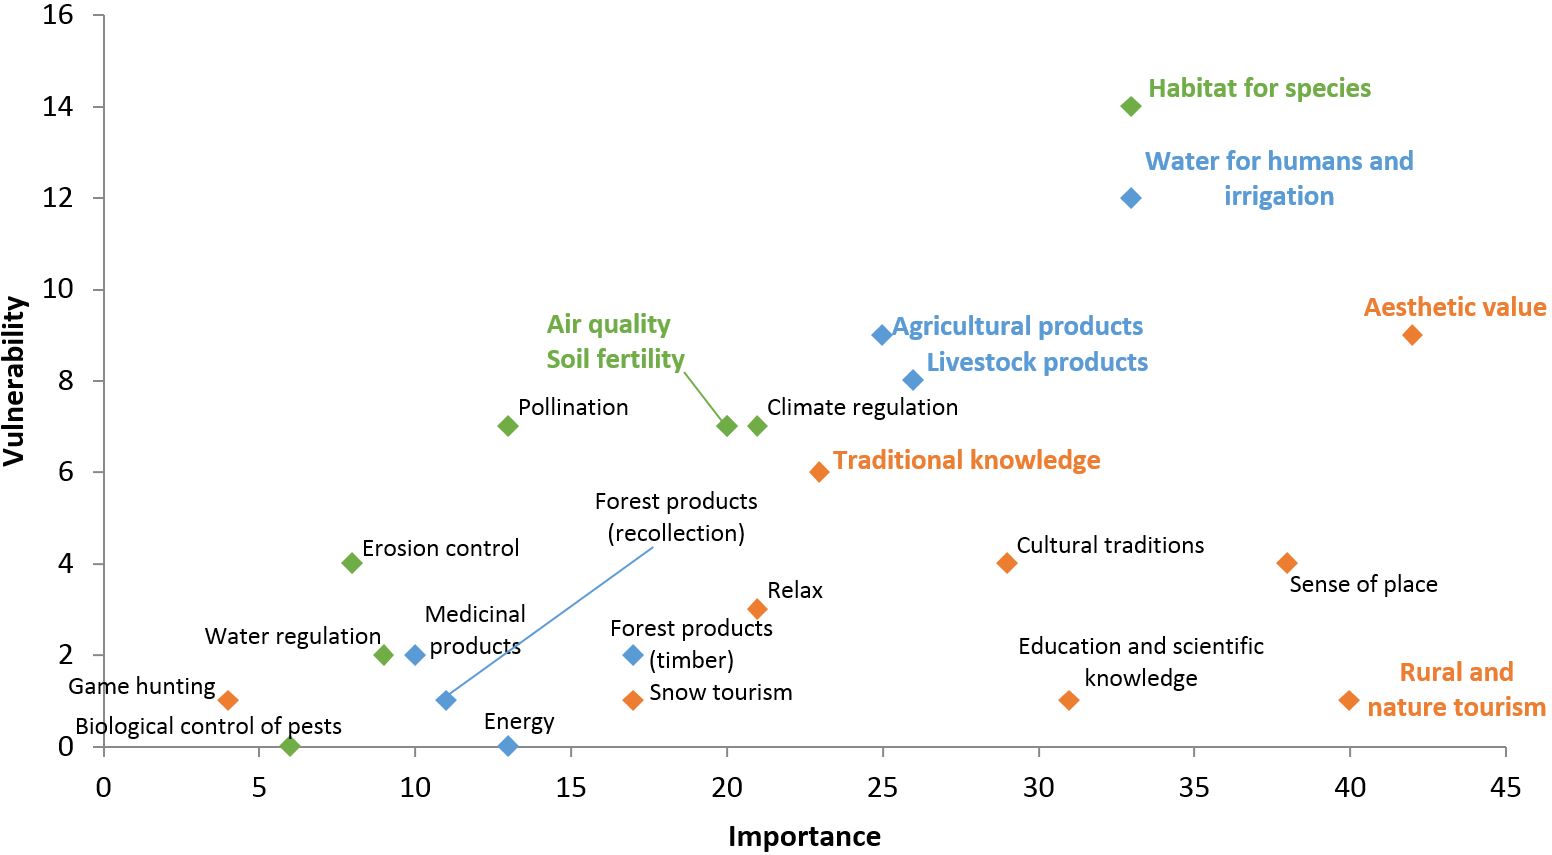
Scatter plot of the importance (X axis) and vulnerability (Y axis) of ES as perceived by key stakeholders during the interviews. Blue, green and orange dots represent provisioning, regulating and cultural services respectively. The names in bold are the selected ES for the workshop.