|
One Ecosystem :
Methods
|
|
Corresponding author: Anda Ruskule (anda.ruskule@bef.lv)
Academic editor: Fernando Santos
Received: 04 Apr 2018 | Accepted: 30 Jul 2018 | Published: 10 Aug 2018
© 2018 Anda Ruskule, Andris Klepers, Kristina Veidemane
This is an open access article distributed under the terms of the Creative Commons Attribution License (CC BY 4.0), which permits unrestricted use, distribution, and reproduction in any medium, provided the original author and source are credited.
Citation:
Ruskule A, Klepers A, Veidemane K (2018) Mapping and assessment of cultural ecosystem services of Latvian coastal areas. One Ecosystem 3: e25499. https://doi.org/10.3897/oneeco.3.e25499
|
|
Abstract
Mapping of cultural ecosystem services (CES) in marine and coastal areas is still recognised as a conceptually and technically challenging task, due to the difficulties in establishing a link between the biophysical features of the coastal ecosystem and the supply of services such as recreation and tourism, bird watching and enjoyment of other assets of nature. This was also one of the major challenges in ecosystem service mapping for the Maritime Spatial Plan for Internal Waters, Territorial Waters and Economic Exclusive Zone of the Republic of Latvia. Suitability of the coastal areas for marine tourism and leisure activities was chosen as an indicator to map the CES – physical and experiential interactions. The method involved the compilation of field data from a survey of visitors at the beach and on coastal infrastructure, serving as the input for the multi-criteria assessment of CES. Four criteria were applied to assess the suitability of the coastal areas for marine tourism and leisure activities: i) accessibility; ii) proximity to densely populated areas; iii) suitability of the area for a particular (niche) tourism or leisure activity; and iv) recreational use. The selected criteria provide an overall assessment framework, which integrates the ecosystem service potential, benefiting areas, flow and demand aspects. The CES mapping and assessment results were applied to the maritime spatial planning for proposing areas of priority for tourism development, as well as assessing the impacts of the proposed solutions for other uses of the sea. The Latvian approach for mapping of the cultural services in coastal areas was selected as the ESMERALDA case study and examined at the stakeholder workshop in Prague, September 2016.
Keywords
Cultural ecosystem services; mapping and assessment; maritime spatial planning; tourism potential; multi-criteria analysis
Introduction
Coastal ecosystems are amongst the most productive in the world, generating different ecological functions and services essential for human well-being (
Coastal tourism and recreation represent the Cultural Ecosystem Services (CES) of high relevance for MSP and coastal zone management. Remarkable growth of the tourism sector in Southern Europe, as well as the countries around the North Sea and the Baltic Sea, has increased its role as a major driver for local employment and regional economic development and, at the same time, increasing the pressure on the environment (
Despite the high decision-making relevance for coastal and maritime spatial planning, the mapping of CES in coastal areas is still recognised as a conceptually and technically challenging task and is consequently under-represented in the overall efforts of ecosystem service mapping and assessment (
Tourism and recreation is a category of the CES, which is conceptually easier to identify and measure (
The CES mapping approaches are often trans-disciplinary, covering bio-physical, socio-cultural as well as economic dimensions (
The suitability of the Latvian coastal areas for tourism and leisure activities was one of the ecosystem services mapped for the development of the draft Maritime Spatial Plan for Latvian marine waters in 2015 (subsequently referred to as – the Latvian MSP case), carried out from January 2015 to May 2016 (
The aim of this paper is to demonstrate an approach of mapping the suitability of the coastal areas for the recreational services supply by applying the multi-criteria assessment framework built on the tourism theory of place attraction. The integration of the tourism theory with the ecosystem service concept is undertaken as a novel inter-disciplinary approach, which can enhance the understanding of the CES supply and demand relationships. The advantages and shortcomings of applying this approach within the Latvian MSP case are discussed in the paper.
Theoretical background for assessing tourism and recreational services
The specificity of CES, related to tourism and recreation, is that the place of service production and where the benefits are realised (
The seaside operates as a nature-based tourism destination where different recreational forms evolve and develop around natural attractions embedded in the ecosystem. The potential of a destination to attract tourists (or recreational potential) depends on the inherent capacity of a location to support recreational activities and thus can be determined by location-specific characteristics of the environment, such as the biophysical attributes of attractions (i.e. scenic attractions) (
The seaside is characterised as a tourism destination, but it could also be linked to a smaller unit, namely, a recreational area serving certain needs of the local population (
Existing habits of using various areas for tourism and leisure purposes characterise the recreational demand for them and this has been studied in certain areas by
Methodology
The choice of the methods for ecosystem service mapping and assessment within the Latvian MSP case was determined by limited data and time resources. Therefore, the tiered approach was followed (
The method for assessment of the suitability of the Latvian coastal areas for tourism and leisure activities was designed by applying the spatial multi-criteria assessment framework, which allows integration of the various information sources from a socio-ecological perspective (
Criteria selection to assess CES – tourism and recreation in coastal areas
Based on the above-described concept of holistic tourism system performance and place attraction (
Criteria groups used for assessment of CES – “Suitability of the coastal areas for marine tourism and leisure activities”, definition of criteria and variables used in the assessment.
|
Criteria |
Definition of criteria |
Variables |
|---|---|---|
|
(A) accessibility |
The criterion characterises the general infrastructure in the coastal area supporting access to the recreational areas |
|
|
(B) proximity to densely populated areas |
The criterion demonstrates potential recreational demand based on proximity to all types of settlement structures, including seasonally densely populated areas maintained for tourism and recreational purpose (e.g. camp sites) |
|
|
(C) suitability of the area for a particular (niche) tourism or leisure activity |
The criterion represents the most favourable physical & social conditions for certain niche tourism types |
|
|
(D) recreational use |
The criterion demonstrates intensity of attendance of tourists or one-day visitors at particular locations. |
|
Ecosystem typology and selection of the assessment units
Although the Latvian coastal area represents diverse marine and coastal habitats, including habitats of EU importance (e.g. coastal meadows, coastal dunes, sandy beaches with perennial vegetation or some reefs), mapping of habitats for the whole coastline has not yet been carried out. Therefore, the whole coastal area was taken as a single ecosystem – coastal ecosystem - as defined by the MAES typology (
Data collection and development of the GIS data layers
The data sources, used in assessment of the performance values of the four criteria described above, included the primary field survey results on recreational activities in the coastal areas, performed within previous studies (carried out in 2015): i) visitor survey, performed in 85 field research days during which visitors were counted in three zones (water, seashore and dunes), within 25 representative samples of 1 km cut-off covering 5% of the 497 km long national coastal territory); ii) face-to-face interviews with more than 700 visitors about their motivation, leisure habits and service assessment as well as the background segmentation data in these places; iii) secondary data from a vast database characterising tourism and recreational activities in the past (with focus on number of visits to different coastal places, recreational use of different services, consumption seasonality). That dataset was complemented with the spatial data on settlement structure, infrastructure and natural features of the places available from topographic maps, local and regional spatial planning documents, database of protected areas and several thematic maps on tourism development.
Firstly, the following available data sets on tourism and recreational activities have been compiled:
- Long-term quantitative data series (dating back to 1995 or later) characterising the number of visits in various coastal and marine places – tourist attractions (per year or per event) as geo-located GIS points.
- Long-term quantitative data series about overnight stays and supporting infrastructure (e.g. parking lots, road statistics, equipment rentals etc.).
- Primary data from the visitor survey on intensity, concentration and duration of visits.
- Primary data from the face-to-face interviews on motivation to visit the place, expectations and degree of satisfaction, service assessment and segmentation information.
A large amount of spatial data about visiting certain areas in combination with their accessibility, distance from nearest settlements, infrastructure, nature resources and amenities not only provide analyses for intensity of attendance in each of the places, but also allows it to be generalised for similar situations.
Furthermore, for characterisation of the natural features and assets, determining the suitability of the area for a particular (niche) tourism or leisure activity, the spatial data on Natura 2000 sites and landscape-protected areas, as well as specific infrastructures related to certain nature resources (e.g. bird watching tower on migratory routes or waterfowl, wader bird areas) were compiled.
Subsequently, a number of visits as variable (categorised in five intensity classes) was analysed with a set of other variables (distance to the nearest road, presence of different infrastructure, services and other variables described above) seeking correlation agreement and spatial regularity using ArcGIS software. Strong correlation agreement was indicated between real recreational use to the other three criteria included as well as with some other parameters (no-rain, air temperature above +20 C, wind speed below 10 m/s). The impact on visiting habits was explained in depth from the face-to-face interviews with visitors. Finally, using ArcGIS spatial analyst tools, values were applied for each coastal-marine spatial assessment unit described above.
Assessment scheme of the selected criteria, aggregation of values and attribution to the spatial assessment units
The performance values of the four criteria at each grid cell were obtained by standardisation of the variables’ data, attributed to each criterion, in three value groups (i.e. assigning scores 1-3). Assumptions applied for assigning the value of each criterion to the spatial assessment units (grid cells) are presented in Fig.
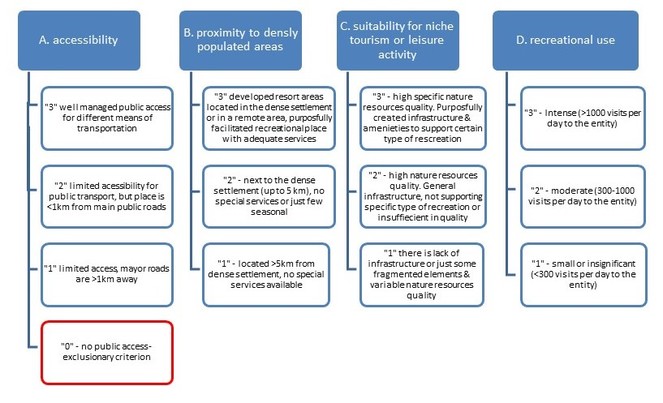
Criterion (A) – “accessibility” was scored based on the distance to the general infrastructure (roads, parking lots). The places which do not provide any public access (e.g. certain harbour areas) would be scored with “0”. In such cases, “accessibility” would perform as an exclusion criterion. However, in the case of the Latvian coast, such closed areas were always smaller than the selected assessment unit (grid cell – 3 km × 2.8 km), therefore such a situation does not appear in the obtained results.
Criterion (B) – “proximity to densely populated areas” is determined by the distance between the recreational area and the settlement providing the recreational demand. This refers not only to permanent settlement structures, but seasonally densely populated areas maintained for tourism and recreational purpose (e.g. camp sites).
Criterion (C) – “suitability for niche tourism or leisure activity” is measured based on the presence of natural qualities and abiotic features, as well as specific supporting infrastructures essential for the particular tourism activities. Benchmarking amongst other similar places used for the same recreational purpose was performed to identify the best place for a particular activity.
Criterion (D) – “recreational use” is determined by the number of visitors. The seasonal maximum for visits per day was used – on a regular occurrence during the high season and also three clusters were made here splitting the data.
The correlation analysis between sample variables of the four criteria calculated before this study reveals several mutual interactions between the two criteria:
- Good accessibility has a positive impact on the growth in number of visits.
- Good accessibility in combination with proximity to densely populated areas produces an even higher growth in number of visits.
- Proximity to densely populated areas without accessibility reduces the number of visits to the minimum.
- Proximity to densely populated areas with poor quality accessibility increases the anthropological impact on the environment (depletion of vegetation).
- Poor quality accessibility and a far distance to the densely populated areas reduces the number of visits to a minimum.
In the next stage, an assessment scale was created to provide an aggregated CES value of each grid cell, which was further used for decision-making in MSP. Assessment classes from 1 to 5 were defined by integrating scores of the four criteria. Value “1” means very low suitability for tourism and leisure activities and “5” – very high suitability. The importance of each criterion was weighted separately for each value class based on expert judgement (see Table
The value aggregation in assessment classes (1-5) representing suitability of the coastal area for marine tourism and leisure activities.
|
Class |
Class descriptor |
Scores and weight of the criteria within the particular value class |
|---|---|---|
|
5 |
very high 80-100% |
A=3 (25%); B=3 (25%); C=2 or 3 (15 or 25%); D=2 or 3 (15 or 25%) The highest value of accessibility with high or moderate other values |
|
4 |
High 65-80% |
A=2 or 3 (15 or 25%); B=2 or 3 (15 or 25%); C=2 or 3 (15 or 25%); D=1-2 (5 or 15%) Existing recreational use is low, but close to the sea-coast there is a larger settlement or site has public accessibility and special infrastructure facilities for certain sea-based tourism or leisure activities (e.g. birding, kitesurfing, angling, boating, nudist beach etc.) – these are amongst the best sites for practising certain activities (not necessarily mass-tourism related) |
|
3 |
Moderate 40-60% |
A=3 (25%); B=1-2 (5 or 15%), C=1-2 (5 or 15%); D=1 (5%) Existing recreational use is low and the site is far (>5 km) from larger settlements. This site is not amongst the best for certain tourism & leisure activities, but it has good public access and there is a parking lot. Mainly extensively used for traditional activities. |
|
2 |
Low 25-40% |
A=1-2 (5 or 15%); B=1 (5%); C=1-2 (5 or 15%); D=1 (5%) Existing recreational use is low and typically seasonal (between 100-300 visits per day to 1 km as a maximum in high season); it is far from larger settlements, but there are some separate tourist accommodations or private buildings nearby. There is a lack of special infrastructure and amenities, which makes accessibility limited. |
|
1 |
very low 0-20% |
A=1 (5%); B=1 (5%); C=1 (5%); D=1 (5%) Other sites with low or very low (<100 visits per day in high season) existing recreational use far from larger settlements, without direct public access from main roads and lack of any specific recreational infrastructure. However, these sites contain nature and landscape quality value and provide important connections between popular places e.g. for long-distance coastal hiking. |
Public involvment
Although the presented study did not include participatory mapping methods or stakeholder involvement in the multi-criteria assessment (e.g. by weighting of the selected criteria), the information on public preference for the recreational areas has been included in the assessment by applying the survey data from the visitor counting along the coastline of Latvia and 700 face-to-face interviews with visitors, revealing the motivation to visit the place, expectations and degree of satisfaction.
Furthermore, the mapping results were presented at the public hearing of the draft MSP, which included four regional meetings, involving a total of 137 participants (e.g. representatives from municipalities’ administrations, port authorities, nature conservation authorities, tourism entrepreneurs, fishermen etc.). Participants of the public hearing meetings had the opportunity to comment on the ES mapping results as well as to propose adjustments to the identified priority areas for tourism development. Thus, stakeholder engagement through the public hearing process served as verification of the CES mapping results. The proposals from the public hearing meetings were taken into account when developing the proposed sea use solutions of the draft MSP.
Obtained results
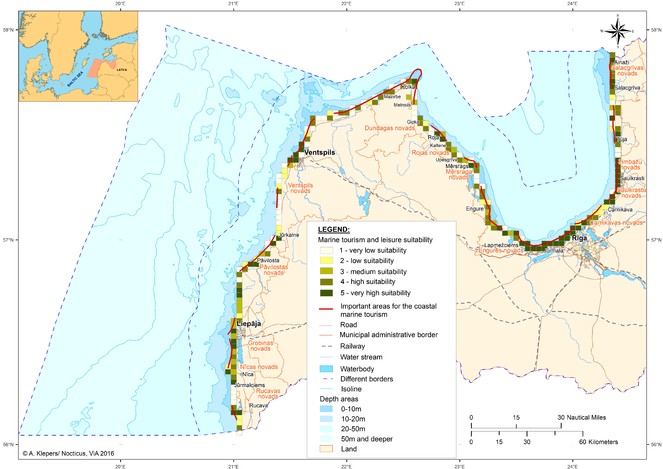
The highest CES values are distributed in the capital city Riga and in the adjacent area covering about a 30-40 km radius. The area is intensively visited for short-duration trips, including single-day visits. Similar high CES values were obtained in areas around two other larger cities of the country – Liepaja and Ventspils. Both cities have a high number of local visitors, as well as organised festivals and other seasonal attractions to increase the number of beach visitors through offered social attractions. The urban coastal zones are also classified as bathing waters, having adequate facilities to serve a large number of visitors.
Several “hot spot” areas stand out, where unique natural phenomena (e.g. areas of outstanding geomorphological features and scenic landscape) can be observed or enjoyed. These areas also have scenic beauty and attractions that contribute to the overall CES of the location. One of them is the Cape of Kolka, where the open Baltic Sea waters meet with the Gulf of Riga waters. This is one of the top tourism destinations, having good public access and infrastructure, as well as providing opportunities for various niche tourism activities. Overall, approximately 27% of the coastal area represents very high suitability for marine and leisure activities.
These are areas which are not so intensively used, although accessibility, infrastructure and nature-based attractions are available. These sites have high potential to become intensively used in future years.
Areas assessed as having very low values (class 1) made up almost one-third of the spatial units. The low value is mainly related to remoteness, poor accessibility andspecific nature conditions (e.g. wet coastal meadows). Coastal areas, assessed as low and medium suitability, take up about 10% each.
Field survey data have identified several locations near to marine waters or coastal areas where accessibility is restricted for tourists or the general public. These are military areas and custom zones in the port areas where, due to security and safety, access is highly regulated. Spatially, such zones are shorter than 3km, thus none of the spatial grid cell has been assessed as not having any CES value. Consequently, all coastal areas supply CES, even if at a very low value.
The ES mapping and assessment provided an input for the first draft Latvian MSP. The obtained results were discussed and verified with local stakeholders (e.g. municipality and port administrations, tourism entrepreneurs etc.) and used for proposing coastal stretches to be designated as “important areas for coastal marine tourism” (see Fig.
Discussion and conclusions
The Latvian MSP case study demonstrates application of the multi-criteria approach in biophysical mapping of CES by prioritisation of the coastal areas according to their suitability for marine tourism and leisure activities. The applied method was based on coastal survey data and expert knowledge in assessment of the selected criteria, which were derived from the concept of holistic tourism system performance and place attraction (
From a socio-ecological perspective, tourism and recreation are tightly connected with the perception of ecosystem services’ supply and demand.
The set of criteria selected in our study allows integration into the assessment of the capacity of the ecosystem to supply and demand for tourism and recreation – “accessibility” and “suitability of the area for a particular tourism or leisure activity” refers to the ES supply, “recreational use” - to the flow of the service, while “proximity to populated areas” can be used to characterise the potential demand. Although
The main strength of the method lies in its ability to provide a quick assessment of the recreational supply and demand of the coastal areas at national scale, by using survey results and expert knowledge in combination with GIS data on coastal infrastructure, settlement structure and population density. Thus, the assessment is based on empirical data, instead of using certain biophysical features (e.g. land cover or habitat type) as proxy for the ecosystem service supply. Such an evidence-based approach provides higher credibility for the spatial planning process and related decision-making on land/sea use priorities.
However, the datasets used for assessment of the service supply within the Latvian MSP case do not demonstrate the direct connection to the coastal ecosystem features, e.g. habitat types, which could also be considered to be a shortcoming of the applied method. This problem was also pointed out during the ESMERADA workshop in Prague, 2016, where the particular case was examined.
The linkage of the CES, such as physical and experiential interactions to particular habitat type, is recognised as particularly problematic in relation to marine and coastal ecosystems (
Furthermore, as noted by
Other factors, which are essential for assessing the suitability of the coastal areas for tourism and recreation, but not included in this study, are those related to the ecosystem condition, e.g. bathing water quality (
As noted before, due to the very tight time schedule of the Latvian MSP case, this study did not include participatory mapping methods to study the public perceptions and spatial distribution of recreational experiences, as recommended by
The main limitation of the applied method is its dependence on availability of visitor survey data and expert knowledge on distribution of the amenities related to marine tourism and leisure. The Latvian MSP case used available survey data and a tourism database developed within recent parallel studies, therefore implementation of the method was possible within the limited time period and human resources (data processing and analysis took approximately two weeks for one expert). If such data had to be collected for the purpose of the CES assessment, implementation of the method would be very costly and time-consuming.
The applied method has proven to be an effective tool for providing evidence-based information on the suitability of coastal areas for tourism and recreation and thus serves as an essential input to the Maritime Spatial Planning process for prioritisation of marine and coastal areas for certain development interests, as well as assessing impacts of the proposed spatial solutions on ecosystem service supply (
The obtained mapping results on the service supply and demand can be used to assess the relationship to the coastal habitat types and thus serves as input to other biophysical ecosystem service mapping methods, which are based on modelling. This would also ensure adjustment of the models to the local conditions and recreational patterns. Furthermore, integration with socio-cultural methods, including surveys on preference assessment or deliberative methods based on group discussions, would be beneficial for use of the local knowledge as well as revealing peoples’ views on the benefits and values associated with CES (
Acknowledgements
The mapping and assessment of the CES of the Latvian coastal areas was carried out within a project co-funded by the European Economic Area Financial Mechanism, activity "Research for Maritime Spatial Planning” (project No.4.3-23/EEZ/INP-001). This paper was prepared within the framework of the project “ESMERALDA”, receiving funding from the European Union’s Horizon 2020 research and innovation programme under grant agreement No 642007.
Funding program
Horizon 2020
Grant title
ESMERALDA: Enhancing ecoSysteM sERvices mApping for poLicy and Decision mAking. Project ID: 642007 Funded under:
Conflicts of interest
There are no conflicts of interest.
References
- An empirical analysis of cultural ecosystem values in coastal Landscapes.Ocean & Coastal Management142:49‑60. https://doi.org/10.1016/j.ocecoaman.2017.03.019
- Subjective well-being indicators for large-scale assessment of cultural ecosystem services.Ecosystem Services21:258‑269. https://doi.org/10.1016/j.ecoser.2016.07.015
- Decision-guide: selecting decision-support tools for marine spatial planning. http://www.centerforoceansolutions.org/sites/default/files/publications/cos_msp_guide_6.pdf. Accessed on: 2018-2-23.
- GIS-based Modelling of Recreational Potential of Nature-Based Tourist Destinations.Tourism Geographies10(2):233‑257. https://doi.org/10.1080/14616680802000089
- Tourism. Principles and Practice.2nd edition.Longman, Prentice Hall,Jersey.
- Contemporary Tourism. An International Approach.Elsevier, Butterworth-Heinemann,Oxford, Burlington, MA.
- Valuing the commons: An international study on the recreational benefits of the Baltic Sea.Journal of Environmental Management.156:209‑217. https://doi.org/10.1016/j.jenvman.2015.03.038
- Baltic International Symposium (BALTIC).2012 IEEE/OES. https://doi.org/10.1109/BALTIC.2012.6249166
- Drakou E, Liquete C, Beaumont N, Boon A, Viitasalo M, Agostini V (2017) Mapping marine and coastal ecosystem services. In: Burkhard B, Maes J (Eds) Mapping Ecosystem Services.Pensoft Publishers,Sofia,374pp.
- Marine and coastal ecosystem services on the science–policy–practice nexus: challenges and opportunities from 11 European case studies.International Journal of Biodiversity Science, Ecosystem Services & Management13(3):51‑67. https://doi.org/10.1080/21513732.2017.1417330
- Multi-criteria decision analysis for nature conservation: A review of 20 years of applications.Methods in Ecology and Evolution9:42‑53. https://doi.org/10.1111/2041-210X.12899
- Communication from the Commission to the European Parliament, the Council, the European Economic and Social Committee and the Committee of the Regions. Blue Growth opportunities for marine and maritime sustainable growth. COM/2012/0494 final.European Commission
- Directive 2008/56/EC of the European Parliament and of the Council of 17 June 2008 establishing a framework for community action in the field of marine environmental policy (Marine Strategy Framework Directive).European Parliament and the Council of the European Union
- Directive 2014/89/EU of the European Parliament and of the Council of 23 July 2014 establishing a framework for maritime spatial planning.European Parliament and the Council of the European Union (EP CEU)
- Defining and classifying ecosystem services for decision making.Ecological Economics68(3):643‑653. https://doi.org/10.1016/j.ecolecon.2008.09.014
- Conceptualising cultural ecosystem services: a novel framework for research and critical engagement.Ecosystem Services21:208‑217. https://doi.org/10.1016/j.ecoser.2016.09.002.
- The Desdtination as a Concept: A Discussion of the Business-related Perspective versus the Socio-cultural Approach in Tourism Theory.Scandinavian Journal of Hospitality and Tourism2(2):92‑108. https://doi.org/10.1080/15022250216287
- Cultural ecosystem services in the context of offshore wind farming: a case study from the west coast of Schleswig-Holstein.Ecological Complexity7:349‑358. https://doi.org/10.1016/j.ecoser.2016.09.002
- Benefits of coastal recreation in Europe: Identifying trade-offs and priority regions for sustainable management.Journal of Environmental Management152:218‑229. https://doi.org/10.1016/j.jenvman.2015.01.047
- Grêt-Regamey A, Weibel B, Rabe SE, Burkhard B (2017) A tiered approach for ecosystem service mapping. Applying ecosystem service mapping in marine areas. In: Burkhard B, Maes J (Eds) Mapping Ecosystem Services.Pensoft Publishers,Sofia,374pp.
- Modeling benefits from nature: using ecosystem services to inform coastal and marine spatial planning.International Journal of Biodiversity Science, Ecosystem Services & Management1:1‑15. https://doi.org/10.1080/21513732.2011.647835
- Tourism Planning.Crane Russak,New York.
- Tourism Planning: Basics, Concepts and Cases.Francis and Taylor,Washington.
- Common International Classification of Ecosystem Services (CICES), Version 4.3. Report to the European Environment Agency. www.cices.eu. Accessed on: 2016-9-10.
- Navigating coastal values: participatory mapping of ecosystem services for spatial planning.Ecological Economics82:104‑113. https://doi.org/10.1016/j.ecolecon.2012.07.008
- Kopperoinen L, Luque S, Tenerelli P, Zulian G, Viinikka A (2017) Mapping cultural ecosystem services. In: Burkhard B, Maes J (Eds) Mapping Ecosystem Services.Pensoft Publishers,Sofia,374pp.
- A multi-criteria approach for an integrated land-cover-based assessment of ecosystem service provision to support landscape planning.Ecological indicators21:54‑66. https://doi.org/10.1016/j.ecolind.2011.12.010
- Landscape, facilities and visitors: An integrated model of recreational ecosystem services.Ecosystem ServicesIn Presshttps://doi.org/10.1016/j.ecoser.2018.02.016
- Bridging the gap between ecosystem service assessments and land-use planning through Multi-Criteria Decision Analysis (MCDA).Environmental Science & Policy62:45‑56. https://doi.org/10.1016/j.envsci.2016.02.013
- The framework of tourism: Towards a definition of tourism, Tourist and the Tourist industry.Annals of Tourism Research6(4):390‑407. https://doi.org/10.1016/0160-7383(79)90003-3
- Tourism attraction system.Annals of Tourism Research77(3):367‑384. https://doi.org/10.1016/0160-7383(90)90004-B
- Mapping and Assessment of Ecosystems and their Services. An analytical framework for ecosystem assessments under action 5 of the EU biodiversity strategy to 2020.Publications office of the European Union,Luxembourg.
- Mapping and Assessment of Ecosystems and their Services: Indicators for Ecosystem Assessments Under Action 5 of the EU Biodiversity Strategy to 2020.Publications Office of the European Union,Luxembourg.
- A systematic quantitative review of coastal and marine cultural ecosystem services: current status and future research.Marine Policy74:25‑32. https://doi.org/10.1016/j.marpol.2016.09.004
- Non-monetary valuation using Multi-Criteria Decision Analysis: Sensitivity of additive aggregation methods to scaling and compensation assumptions.Ecosystem Services29:13‑22. https://doi.org/10.1016/j.ecoser.2017.10.022
- Methods for mapping ecosystem service supply: A review.International Journal of Biodiversity Science, Ecosystem Services & Management8:17‑25. https://doi.org/10.1080/21513732.2012.663792
- Social-ecological dynamics of ecosystem services: livelihoods and the functional relation between ecosystem service supply and demand - evidence from Socotra archipelago, Yemen and the Sahel region, West Africa.Sustainability9(7):1037. https://doi.org/10.3390/su9071037
- Ecosystem services supply and demand assessment: Why social-ecological dynamics matter.Ecosystem Services30:124‑125. https://doi.org/10.1016/j.ecoser.2018.02.009
- Cultural ecosystem services: a literature review and prospects for future research.Ecology and Society18(3):44. https://doi.org/10.5751/ES-05790-180344
- Ecosystems and human well-being: synthesis report.Island Press,Washington, DC.
- The Destination Product and its Imapct on Traveller Perceptions.Tourism Management21:43‑52. https://doi.org/10.1016/S0261-5177(99)00080-1
- Mapping ecosystem services for marine spatial planning: Recreation opportunities in Sub-Antarctic Chile.Marine Policy81:211‑218. https://doi.org/10.1016/j.marpol.2017.03.038
- Mapping cultural ecosystem services: A framework to assess the potential for outdoor recreation across the EU.Ecological Indicators45:371‑385. https://doi.org/10.1016/j.ecolind.2014.04.018
- Mapping recreation supply and demand using an ecological and a social evaluation approach.Ecosystem Services13:108‑118. https://doi.org/10.1016/j.ecoser.2014.12.008.
- The recovery of estuarine quality and the perceived increase of cultural ecosystem services by beach users: A case study from northern Spain.Journal of environmental management212:450‑461. https://doi.org/10.1016/j.jenvman.2018.02.033
- The value of marine biodiversity to the leisure and recreation industry and its application to marine spatial planning.Marine Policy34:868‑875. https://doi.org/10.1016/j.marpol.2010.01.009
- Rink D, Emmrich R (2005) Surrogate Nature or Wilderness? Social Perceptions and Notions of Nature in an Urban Context. In: Kowarik I, Körner S (Eds) Wild Urban Woodlands.Springer-Verlag
- See the Baltic Sea. Unique assets we share.Baltic Environmental Forum – Latvia,Riga.
- Mapping recreation as an ecosystem service: Considering scale, interregional differences and the influence of physical attributes.Landscape and Urban Planning175:149‑160. https://doi.org/10.1016/j.landurbplan.2018.03.011
- Tourism Analysis: a Handbook.2nd edition.Longman,Harlow.
- Spatial indicators for the assessment of ecosystem services: providing, benefiting and connecting areas and landscape metrics.Ecological Indicators21:80‑88. https://doi.org/10.1016/j.ecolind.2012.02.013
- Application of the marine ecosystem services approach in the development of the maritime spatial plan of Latvia.International Journal of Biodiversity Science, Ecosystem Services & Management13(1):398‑411. https://doi.org/10.1080/21513732.2017.1398185
- Impacts of changes in water quality on recreation behaviour and benefits in Finland.Journal of Environmental Management91:4‑984. https://doi.org/10.1016/j.jenvman.2009.12.005
- A multi-indicator framework for mapping cultural ecosystem services: the case of freshwater recreational fishing.Ecological Indicators45:255‑265. https://doi.org/10.1016/j.ecolind.2014.04.001
- The measurement of place attachment: validity and generalizability of a psychometric approach.Forest Science49(6):830‑840.
- ESTIMAP: A GIS-based model to map ecosystem services in the European Union.Annali di Botanica4:1‑7. https://doi.org/10.4462/annbotrm-11807