|
One Ecosystem : Methods
|
|
Corresponding author: C. Sylvie Campagne (sylviecampagne@gmail.com)
Academic editor: Fernando Santos
Received: 31 Jan 2018 | Accepted: 26 Apr 2018 | Published: 03 May 2018
© 2018 C. Sylvie Campagne, Philip Roche
This is an open access article distributed under the terms of the Creative Commons Attribution License (CC BY 4.0), which permits unrestricted use, distribution, and reproduction in any medium, provided the original author and source are credited.
Citation: Campagne C, Roche P (2018) May the matrix be with you! Guidelines for the application of expert-based matrix approach for ecosystem services assessment and mapping. One Ecosystem 3: e24134. https://doi.org/10.3897/oneeco.3.e24134
|
|
Abstract
Matrices or look-up tables are increasingly popular flexible tools for ecosystem services mapping and assessment. The matrix approach links ecosystem types or land cover types to ecosystem services by providing a score for ecosystem service (ES) capacity, supply, use, demand or other concepts. Using expert elicitation enables quick and integrative ES scoring that can meet general demand for validated ES mapping and assessment at different scales. Nevertheless, guidance is needed on how to collect and integrate expert knowledge to address some of the biases and limits of the expert elicitation method. This paper aims to propose a set of guidelines to produce ES matrices based on expert knowledge. It builds on existing literature and experience acquired through the production of several ES matrices in several ES assessments carried out in France. We propose a 7-steps methodology for the expert-based matrix approach that aims to promote cogency in the method and coherency in the matrices produced. The aim here is to use collective knowledge to produce semi-quantitative estimates of ES quantities and not to analyse individual or societal preferences or importance of ES. The definition of the objectives and the preparation phase is particularly important in order to define the components of capacity to demand ES chain to be addressed. The objectives and the ES components addressed will influence the composition of the expert panel. We recommend an individual filling of an empty matrix in order to strengthen the statistical analysis of the scores' variability and the analysis of congruency between experts. Expert scoring should follow a process of discussion, information-sharing and collective appropriation of a list of ecosystem types and ES to be assessed. We suggest that the ES matrix should not only focus on ES central scores but also address the variabilities and uncertainties as part of the ES assessment. The analysis of these sources of variability allows the documentation of variations in the ES quantity but also an exploration into the lack of consensus or knowledge gaps that needs to be addressed.
Keywords
Ecosystem services mapping tool; Expert elicitation; matrix approach; methodology; scoring; look-up table
Introduction
Increasing demand for local and regional-scale ecosystem service (ES) mapping and assessment to support biodiversity management (
Various methods for assessing ES have been used in various studies (see
Amongst the different methods available, spatial proxy models — which link land cover classes or ecosystem types to ES — are very flexible and readily adaptable to different data sources and modelling techniques. The matrix approach — particularly with participatory expert-based scoring as developed here — has proven to provide rapid and readily-appropriable ES assessments (
The matrix approach is increasingly being applied (Fig.
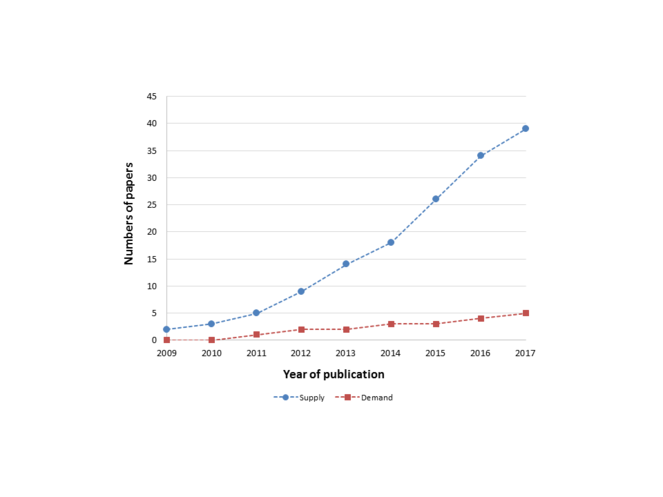
Trends in the number of published studies mobilising the matrix approach to assess ecosystem service supply and demand between 2008 and 2017 (source: WoS, Google Scholar and Scopus).
The methodology we propose here aims to reduce biases linked to interpretation and influence biases when using the expert-based matrix approach for ES scores elicited best-knowledge estimates, not individual preferences. Indeed, it is possible to estimate the biophysical capacity, economic or social value of ecosystem services of different ecosystem types by knowledge or preference elicitation methods based on individual interviews and/or collective deliberative workshops. This is the case for the widely-used multi-criteria approaches, ranking methods and life satisfaction approaches and also for other less frequently used methods, such as the Q method (
The method presented here is a knowledge elicitation protocol aiming to evaluate the capacity of different ecosystem types to provide their best evaluation of the potential (or the use, the demand etc.) of each ecosystem type to provide ES. So the ES scores elicited are not individual preferences (i.e.
Methods
Guidance is needed on how expert knowledge should be collected and integrated to construct scientifically sound ES evaluations (
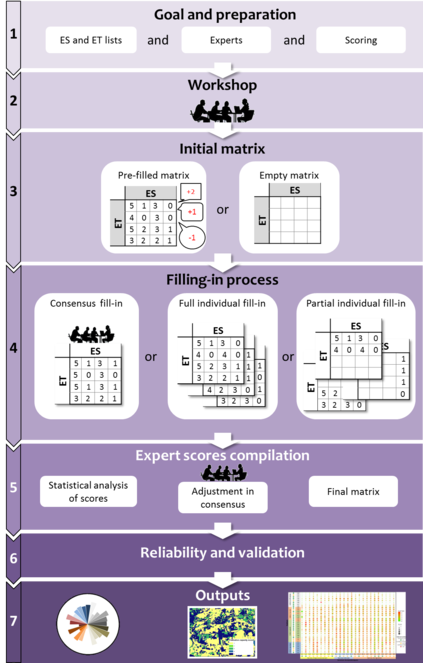
Step 1 - Goal and preparation phase
Clarifying the goals and objectives of the assessment is the first step of the process. The objectives will determine the list and degree of detail of ES and ecosystem types (ET) considered which in turn will determine the size of the matrix and influence how the participatory approach is set (
The flexibility of the matrix approach means it can be readily adapted to assess different components of the ES supply-demand chain: supply (e.g.
(a) Ecosystem services and ecosystem types
Linked to the objectives, the ES and ET evaluated have to be precisely defined with detailed and well defined definition and examples. Any list of ES could be used, but we do recommend using a standard list as reference, such as CICES V5.1 (
ET are basically the ecosystem or LC types found in the case-study area which, depending on the goal, may be based on different typologies and on the LC data available. One limit would be the number of ET to be considered: a highly precise typology will lead to a very large matrix, which will create time management issues and difficulties for experts to provide estimates on closely-related ET. It is possible to reduce the number of ET by merging ET that are able to provide the same levels of ES. This was done in the application on the Scarpe-Escaut Regional National Park (RNP) in France (
The preparation phase following the definition of the objectives should be done with key stakeholders with a helicopter view of important issues for the area considered in order to define a tailored ES and ET lists and adapt each title, definition and example to the ES and ET for the case study. In order to be efficient, we recommend that the ES and ET lists are definitively defined and validated before the workshop and not re-discussed during the scoring workshop.
(b) Expert panel
Our definition of ‘expert’ is a person with extensive knowledge or skills based on research, experience or occupation in a particular field who could give a reasonable evaluation of the ES associated with different ET within the area studied (
(c) The scoring
The main scoring scheme used in the literature is based on
Besides the score value for each ES/ET combination, we recommend asking the experts to provide an indication of their confidence on the ET and ES considered. In our case-study sites, we asked the experts to fill in a confidence index for each ES and each ET. This confidence index was used to estimate expert confidence in providing the capacity score and could be used to compute score errors (
Step 2 - Workshop
The main aim of the workshop is to harmonise understanding of the nature of the ES and the ET assessed and get a common understanding of the goal of the study. The workshop should bring together all the experts and stakeholders in the study. The presentation must be adapted to the public and its diversity of expertise. We recommend taking the time to present each ES and each ET with a precise definition, a local example and a picture. Caution should be taken to limit the cognitive biaises associated with the example and the picture and using several examples is better. The workshop is also designed to allow the experts to ask any and all questions they may have and to create interaction amongst all participants. A detailed presentation of the approach, the methodology and all definitions can help narrow differences in interpretations of the ES, the ET and, above all, the ES chain component addressed.
Different expert elicitation protocols or methods in citizen science could be used (
If it is impossible to bring the entire expert panel together during the workshop, the experts can be met individually in order to obtain the appropriate expert panel size and all the necessary expertise, although this option is less attractive as it prevents interaction and discussion. The analyses of the variabilities between experts (Step 5 and 6) may allow to identify ES/ET combinations with high variability, low confidence and/or low inter-rater consensus. This could open the possibility of organising a second workshop to address specifically those cases.
Step 3 - Initial matrix
Two main options can be used as starting point to the filling-in process: using a pre-filled matrix or using an empty matrix (Table
Overview of the different options for the initial matrix and the filling-in process.
| INITIAL MATRIX | FILLING PROCESS | |||||
| Pre-filled matrix | Empty matrix | Filling in consensus | Full individual filling | Partial individual filling | Individual filling + consensus round | |
| Description | Based on a pre-filled matrix, experts adjust the pre-filled scores | Each score has to be defined | Use a workshop with all experts to discuss each score and forge a final consensus score | Each expert fills in the matrix | Each expert completes the part of the matrix tied to their expertise | After an individual fill-in, a “second round” discussing the scores with high variance |
| Resources | Preliminary studies, bibliography, pre-existing matrices | None | Workshop, trained facilitators | Preparatory workshop | Preparatory workshop | Technical logistic |
| Time | Variable depending on data sources availability | None | Long time with all experts depending on size of the matrix and number of experts | ½ day workshop + 30 s to 1 min/cell | ½ day workshop + 0.5 min/cell | ½ day workshop + 0.5/1 min/cell + 1 day consensus workshop. |
| Pros | Quicker than with an empty matrix | No influence- analytical and statistical benefits |
Consensus validation - Collective intelligence - Capacity building - Most of the work done during the workshop |
No interaction biases - Easy to organise - Statistical power |
Experts only score in their field of expertise - Quick |
All expertise -sets are taken into account - Analytical and statistical benefits - Consensus validation |
| Cons |
Experts are influenced by the pre-filled scores Difficult to differentiate whether pre-filled scores left unchanged because the expert did notthink he/she had the knowledge to credibly change them or because he/she agreed with them- Variability and reliability statistics meaningless |
Time-intensive |
All Experts in attendance at the workshop Long workshop that needs well-trained facilitators Power and personality influence biases Difficult to organise (time availability of the Experts) |
Long for the Experts Less expert input due to the time it takes to fill in the whole matrix Individual fill-in may introduce personal understanding biases |
Needs 10–15 people per type of expertise = lot of people Difficult to have the same number of experts per score More complex for statistical analysis |
All Experts must be present at the consensus workshop Difficult to organie (time availability of the Experts) |
Pre-filled matrix
With the development of the matrix approach, the literature counts a number of matrices that can be adapted and used as initial matrix (Fig.
Empty matrix
Another approach is to start with an empty matrix where each score has to be defined by each expert. The process is longer, but it has no influence from pre-filled scores and is more adapted to computation of statistics that requires independency of the dataset.
Step 4 - Filling-in the matrix
Three different options are presented to fill in the matrix: filling in consensus, full individual filling and partial individual filling. Each option can be applied with a pre-filled matrix or an empty matrix. Also the individual filling can be completed with a consensus round method as explained in Step 5. The pros and cons of each method are summarised in Table
- Consensus fill-in
All experts need to be present during a workshop and each score is discussed in order to adjust or set each score in a consensus. It is a long collective process but not a long individual process as the final matrix is defined at the end of the workshop. It is important to facilitate the discussion in order to reduce power and personality influences (
- Full individual fill-in
Each expert adjusts or defines each score of the matrix. It is a long individual process and fewer experts may contribute as they have to take the time independently (feedback teaches us that an 800-scores matrix takes about 3-4 hours to complete in full starting with a empty matrix) but all expertise is taken into account and it is the most convenient method for statistical analysis since it is based on independent replicates (individual scoring) and homogeneous sampling size (same number of raters for every score). Accordingly, usual parametric statistics can be used, as well as concordance indexes (see Step 5 and 6).
- Partial individual fill-in
Each expert adjusts or completes the part of the matrix related to their expertise. Depending on the expertise, the individual process is shorter than with a full individual fill-in and allows more experts to participate. Experts will thus only provide scores for the ES/ET combination they consider within their core expertise. With an empty matrix, 10 to 15 people are needed for each score in order to reach a suitable panel size. In a partial individual fill-in process, it may prove difficult to ensure that at least 10 to 15 different experts complete each score and many specific services and LC types may not have enough statistical robustness.
In both individual fill-in procedures, the experts can continue to fill the matrix after the workshop. Whatever the matrix-filling method used, the number of “missing data” (i.e. an expert failed to provide a score) has to be kept as small as possible. Depending on the statistical analysis considered, it is useful to record information on the experts themselves (gender, level of training, job title, organisation, main type of mission, expertise on specific ET etc.) for analysis of score biases.
Step 5 - Compiling the Values
- Statistical central values and variabilities
The central value is generally computed using the arithmetic mean of all individual experts’ scores for each ES/ET combination, but some authors advocate using the median of the individual scores (
Score variabilities can be estimated using the variance, the standard deviation of the scores or the standard error of the mean if the average is used or inter-quartile scores if the median is used. Score variabilities is one approach to identify variabilities in scoring agreement between experts (
- Adjustment in consensus
Following the individual fill-in and the computation of central scores and variabilities, it is possible to conduct a “second round of exchange with the expert panel”, notably to reconsider the scores with high variance (inspired by the Delphi approach;
- Final matrix
The final output of the fill-in process is a final matrix of the central scores that can be completed by a variability matrix and confidence scores (
Step 6 - Reliability and validation
Methods based on inter-rater reliability statistics such as Krippendorff’s alpha (
Step 7 - Outputs
Three main types of outputs are usually interesting for the stakeholders: the ES matrix, maps and bundles graphs. The ES matrix and particularly the central scores matrix can be used directly by the stakeholders for their own analyses, particularly by land managers and land planners. We recommend communicating and raising awareness about the uncertainties and variabilities outputs in their uses. Maps are a second very important type of outputs. The matrix applications have mainly been used for mapping ES (e.g.
It is very important that the results and outputs are communicated back to all the experts who were involved in the assessment so they can see the results of their participation and provide feedback. This diffusion also contributes to the appropriation of the results and dissemination of the study.
Example of application
As an illustrative example, we present an application of the matrix approach in the Alpilles RNP in the south of France. This ES assessment was done in August 2017 (
(Step 1) The goal was to assess the potential impact of a Life+ Nature project on the ES capacity of the ET managed through actions led under the Life+ project. The LIFE is the EU’s financial instrument supporting environmental, nature conservation and climate action projects throughout the EU (http://ec.europa.eu/environment/life/). The LIFE12 NAT/FR/000107 is a LIFE + Nature project on the Alpilles RNP which aims to optimise the link between human activities and the maintenance of ornithological biodiversity, to promote the appropriation of ecological issues by local stakeholders and to strengthen ornithological recognition of the territory by enhancing certain practices. Its actions, analysed here, are restoration of a grass layer in olive groves (A1), plantation of multispecies hedgerows (A2), creation of open areas in dense garrigue scrub by shrub cutting (A3) and implementation of good forestry practices with opened forest by shrub cutting and culling (A4).
Linked to these actions, the ET selected for the matrix are not linked to landcover/use typology but to those addressed by Life actions with before-and-after action states, i.e. Bare-soil olive groves vs. Olive groves with grass cover, Multispecies hedgerows vs. Monospecific cypress hedgerows, Opened garrigue vs. Closed garrigue, Opened coniferous forest vs. Dense coniferous forest. Another 6 ecosystems were also considered in order to factor-in other important ET within the study area, i.e.: Deciduous forest, Rocky habitat, Vineyard with bare soil, Orchards with inter-row grass strips, Grassland, Annual crops. The list of ET was completed by detailed descriptions and local pictures to harmonise participants’ mental representations.
Based on CICES (V4.3,
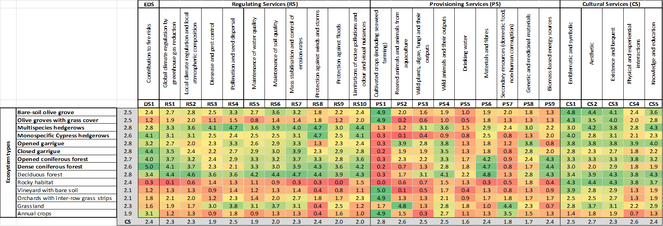
The final capacity matrix with mean ES capacity scores giving mean confidence scores by ET and ES in the table margins. ES = ecosystem service ; EDS = Ecosystem disservices.
Following
In total, the matrix included 14 ET and 24ES+1EDS giving a total of 350 scores. As we assessed the capacity, the experts invited to participate had theoretical and practical knowledge of the local environment and/or ES. The panel of experts counted 5 generalist profiles, 3 forest profiles and 2 naturalist profiles, along with specialist profiles in livestock, agriculture and hunting.
(Step 2) The workshop was held in August 2017 with all the in-panel experts and the course of the workshop followed the previous recommended description.
(Step 3) As the evaluation had a very specific context (assessment of Life action impacts), there was no existing matrix so we started with an empty matrix.
(Step 4) We chose a full individual fill-in to get 12 full matrices and run comparative analysis.
(Step 5) Compilation was by meansof the 12 matrices given equal weight between experts. Adjustment by consensus was not done, as the matrix was too long to be filled in during the workshop and technical reasons made it difficult to organise two workshops. The final matrix is the central scores and mean confidence scores for each ES/EDS and ET (Fig.
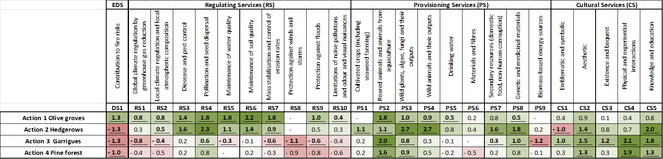
ES impacts of Life actions. Difference between the ES/EDS scores for Life+ action-related ecosystem types (before–after). Bold underlined values indicate significant differences in scores (paired t-tests, p<0.05). ES = ecosystem service ; EDS = Ecosystem disservices.
(Step 6) Comparison with quantitative data or models would have been a challenge, as the application was too specific for reliable comparison against existing data. We computed two indices of inter-rater reliability, i.e. Krippendorff’s alpha and ICC, using the ‘irr’ package in R software. For Krippendorff’s alpha, we considered the scores as interval data and, for the ICC, we considered the consistency of the scoring. The index values ranged from 0.062 to 0.90 for Krippendorff’s alpha and from 0.09 to 0.90 for ICC. All the ICC values were significantly different from 0, indicating some degree of agreement between the experts, but there was nevertheless strong differences in concordance values for the different ES. This indicates that some ES have a very low level of agreement of rating amongst the experts and this has to be further analysed. Eight ES had high ICC values (>0.6), i.e. PS1 "Cultivated crops (including seaweed farming)" (0.9), PS6 "Materials and fibres" (0.63), PS9 "Biomass-based energy sources" (0.61), RS1 "Global climate regulation by greenhouse gas reduction" (0.72), RS2 "Local climate regulation and local atmospheric composition" (0.6), RS7 "Mass stabilisation and control of erosion rates" (0.63), RS8 "Protection against winds and storms" (0.81) and RS10 "Limitations of noise pollutions and odour and visual nuisances " (0.68). DS1 "Contribution to fire risks" had an ICC value of 0.72. This indicates that, for these ES and DS1, the different experts consistently scored the different ET scores in the same rank-order, which means they should be robust. Inter-rater reliability was very low on some ES, such as PS5 "Drinking water" (0.09), PS8 "Genetic and medicinal materials " (0.3) and CS3 "Existence and bequest" (0.27), indicating very low agreement between experts on the scores of the different ET. These results can mean that ES scores for these services lack reliability or that there are diverse interpretations of the ES between experts or these services encompass different types of knowledge that require different types of expertise. Those services should be interpreted with caution and further analyses are needed to understand the cause of the disagreement amongst experts as helicopter interviews of experts and literature reviews.
(Step 7) To illustrate the impact of Life actions, graphs bundles of ES can be used (Fig.
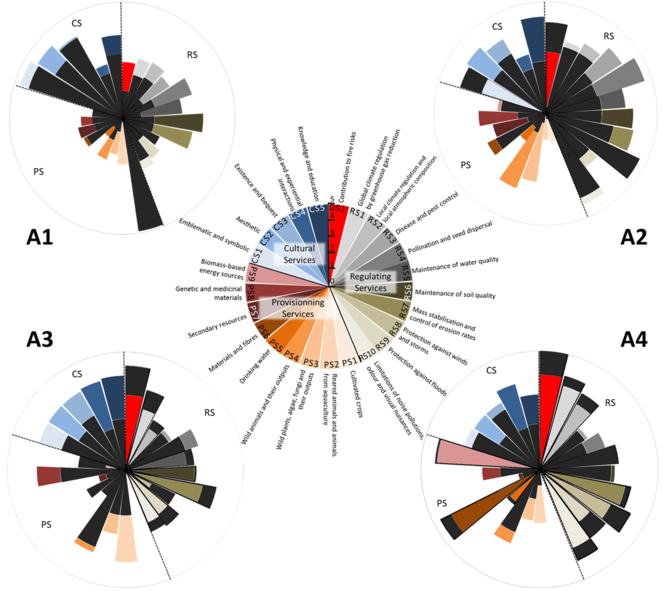
Bundles of ES capacity of the potential Life action impacts.
A1: restoration of a grass layer in olive groves, A2: plantation of multispecies hedgerows, A3: creation of open areas in dense garrigue scrubs by shrub cutting, A4: implementation of good forestry practices with opened forest by shrub cutting and culling. The wedges in the chart are same-shaped: length (radius) indicates the potential capacity of the ET to generate ES, black parts indicate ES provided before the Life actions and colour parts indicate ES provided after the Life actions. When the black part of a wedge exceeds the coloured part, it indicates that the potential is considered higher before than after the Life+ action. If the coloured part exceeds the black part, the potential is considered to be higher after, rather than before, the Life+ action.
These results need to be read in relation to the confidence scores expressed by each expert (averages shown in the margins -in grey- of Fig.
Discussion
We proposed a 7-step methodology for producting an ES matrix based on expert elicitation protocols. The example we presented here was for the sake of demonstrating the implementation and the interest in the proposed methodology. Our methodology aims to promote cogency in the method and coherency in the matrices produced and to reduce biases linked to experts' judgements. In a recently published book,
Pros
Flexibility
We agree with
The matrix approach enables quick ES assessments (
Appropriability
The underlying ES concept, simplicity, flexibility and participatory approach with co-production of the results converge to make the final output readily understandable and appropriable by stakeholders. As in the case applied by
Cost efficiency
The matrix approach and expert elicitation are cost-efficient, as they provide a quick assessment for a large number of ES and a large number of ET (
As shown in Table
Integrative
There have been very few attempts to quantitatively assess regulating services and cultural services due to the fact that available data are scarce and relevant indicator quite complex (European Commission 2014 in
Cons
Spatiotemporal invariance
The matrix gives an average score of ES provided by ET/ LC types. Two distant areas with the same ET will thus have the same scores without accounting for their specificity (
ES provision is temporarily variable (
Lack of consideration of spatial processes
The matrix does not take into account trade-offs and synergies between ES as they form an interaction network (
Expert-based estimates
The results, based on expert judgements, are limited by the experts’ own understanding and interpretation and by a number of cognitive and social biases. However, carefully-designed methods can reduce some of the impact of specific biases (see
Some ES and ET are more difficult to define, which may lead to different interpretations. Moreover, the distinction between the different components of ES notions (supply, capacity, uses, demand etc.) is also debatable and may again lead to different interpretations. The workshop plays an important role in addressing this limitation, as it serves to set aside the time needed to explain all the matrix-related definitions and to go back over them if needed.
An intrinsic limit of expert-based methods is the subjectivity of their estimates. By definition, they are not measurements but a plausible score based on the best knowledge of the experts mobilised (
Relative quantification
As the ES scoring used in the matrix approach is only semi-quantitative and expert-based, we cannot equate the scores directly to actual biophysical quantities, there is an obvious need to confront them to actual or model-based quantitative estimates in order to better define their domain of validity. Some preliminary results seems to indicate a monotone relationship between expert-based ES scores and quantitative estimates but more research is needed.
Conclusion
Finally, we are convinced of the usefulness of the expert-based matrix approach and recommend a complete individual filling with an empty matrix for its fair compromise between the time requested, taking into account all expertise, analytical and statistical advantages and reasonable participatory time to avoid over-solicitation. As presented in the example, we quickly obtained relevant and appropriable results for stakeholders. The flexibility of the approach allows an unlimited adaptation to contextual objectives. However, for the matrix to be with you, this flexibility should be framed in order to achieve results with high scientific standards. We recommend the adoption of our explicitly structured and robust procedure, involving several steps linked with the study design, capacity building, scoring and expert accuracy and uncertainty assessment. However, we strongly recommend that the ES matrix should not only focus on ES central scores, but also address the variabilities and uncertainties as part of the ES assessment.
Acknowledgements
This study was partly supported by the H2020 ESMERALDA project (grant agreement #642007) and the IMAGINE project (ERANET BIODIVERSA 3).
The authors thank the two reviewers for the feedbacks and suggestions; Candice Christin for her support on reviewing the applied matrix approach literature and Juliet Abadie for her general feedbacks.
The applied matrix approach example presented here was carried out by Clément Surun of the Alpilles Regional Natural Park under local supervision from Jean-Michel Pirastru and Lisbeth Zechner and further supervision from Aurélien Guingard of CDC (Caisse des Dépôts copilotée) Biodiversité et la Mission Economie de la Biodiversité. The application was funded by the Alpilles NAT/FR/000107 LIFE programme and the Alpilles Regional Natural Park.
References
-
Incommensurability and monetary valuation.Land economics82(2):141‑161. https://doi.org/10.3368/le.82.2.141
-
Why do dominant personalities attain influence in face-to-face groups? The competence-signaling effects of trait dominance.Journal of personality and social psychology96(2):491‑503. https://doi.org/10.1037/a0014201
-
Mapping Ecosystem Services.Pensoft Publishers,Sofia,374pp.
-
Landscapes‘ Capacities to Provide Ecosystem Services – a Concept for Land-Cover Based Assessments.Landscape Online1(22): . https://doi.org/10.3097/LO.200915
-
Ecosystem based modeling and indication of ecological integrity in the German North Sea—Case study offshore wind parks.Ecological Indicators11(1):168‑174. https://doi.org/10.1016/j.ecolind.2009.07.004
-
Mapping ecosystem service supply, demand and budgets.Ecological Indicators21:17‑29. https://doi.org/10.1016/j.ecolind.2011.06.019
-
Ecosystem Service Potentials, Flows and Demands – Concepts for Spatial Localisation, Indication and Quantification.Landscape Online1‑32. https://doi.org/10.3097/lo.201434
-
Ecosystem services matrix. In: Burkhard B, Maes J (Eds)Mapping Ecosystem Services.Pensoft Publishers,Sofia,374pp.
-
Identifying hotspots and management of critical ecosystem services in rapidly urbanizing Yangtze River Delta Region, China.Journal of Environmental Management191:258‑267. https://doi.org/10.1016/j.jenvman.2017.01.003
-
Expert-based ecosystem services capacity matrices: Dealing with scoring variability.Ecological Indicators79:63‑72. https://doi.org/10.1016/j.ecolind.2017.03.043
-
Looking into Pandora’s Box: ecosystem disservices assessment and correlations with ecosystem services.Ecosystem Services30:126‑136. https://doi.org/10.1016/j.ecoser.2018.02.005
-
Implications of land cover change on ecosystems services and people’s dependency: A case study from the Koshi Tappu Wildlife Reserve, Nepal.Ecological Complexity28:200‑211. https://doi.org/10.1016/j.ecocom.2016.04.002
-
Elicitation by design in ecology: using expert opinion to inform priors for Bayesian statistical models.Ecology90(1):265‑277. https://doi.org/10.1890/07-1886.1
-
Impacts of Land Cover Changes on Ecosystem Services Delivery in the Black Hills Ecoregion from 1950 to 2010. Theses and Dissertations.South Dakota State University,162pp.
-
The inclusion of stakeholders and cultural ecosystem services in land management trade-off decisions using an ecosystem services approach.Landscape Ecology31(3):533‑545. https://doi.org/10.1007/s10980-015-0260-y
-
Mapping ecosystem services potential in Lithuania.International Journal of Sustainable Development & World Ecology23(5):441‑455. https://doi.org/10.1080/13504509.2016.1146176
-
Toward rigorous use of expert knowledge in ecological research.Ecosphere4(7):art83. https://doi.org/10.1890/es12-00415.1
-
Mapping the ecosystem service delivery chain: Capacity, flow, and demand pertaining to aesthetic experiences in mountain landscapes.Science of The Total Environment574:422‑436. https://doi.org/10.1016/j.scitotenv.2016.08.209
-
The nature and role of experiential knowledge for environmental conservation.Environ. Conserv33:1‑10. https://doi.org/10.1017/S037689290600275X
-
Strategic Management: a Stakeholder Approach.Basic Books,New York.
-
I Think Therefore I Am (Influenced): Perceptions of Social Influence onSelf and Others.International Review of Social Psychology30(1):193. https://doi.org/10.5334/irsp.33
-
Ecosystem services in environmental impact assessment and strategic environmental assessment.Environmental Impact Assessment Review40:1‑2. https://doi.org/10.1016/j.eiar.2013.02.005
-
Linking GIS-based models to value ecosystem services in an Alpine region.Journal of Environmental Management89(3):197‑208. https://doi.org/10.1016/j.jenvman.2007.05.019
-
A tiered approach for mapping ecosystem services.Ecosystem Services13:16‑27. https://doi.org/10.1016/j.ecoser.2014.10.008
-
A tiered approach for ecosystem services mapping. In: Burkhard B, Maes J (Eds)Mapping Ecosystem Services.Pensoft Publishers,Sofia,374pp.
-
CICES V4.3 – Report Prepared FollowingConsultation on CICES Version 4.EEA FrameworkContract No
-
Common International Classification of Ecosystem Services (CICES) V5.1 and Guidance on the Application of the Revised Structure.EEA. URL: www.cices.eu
-
Selecting methods for ecosystem service assessment: A decision tree approach.Ecosystem Serviceshttps://doi.org/10.1016/j.ecoser.2017.09.016
-
Assessment framework for landscape services in European cultural landscapes: an Austrian Hungarian case study.Ecol. Indic37:229‑240. https://doi.org/10.1016/j.ecolind.2013.01.019
-
Uncertainties in landscape analysis and ecosystem service assessment.J. Environ. Manage127:117‑131. https://doi.org/10.1016/j.jenvman.2012.12.002
-
Landscape׳s capacities to supply ecosystem services in Bangladesh: A mapping assessment for Lawachara National Park.Ecosystem Services12:128‑135. https://doi.org/10.1016/j.ecoser.2014.11.015
-
‘The Matrix Reloaded’: A review of expert knowledge use for mapping ecosystem services.Ecological Modelling295:21‑30. https://doi.org/10.1016/j.ecolmodel.2014.08.024
-
Applying expert knowledge for ecosystem services quantification.In: Burkhard B, Maes J (Eds)Mapping Ecosystem Services.Pensoft Publishers,Sofia,374pp.
-
Mapping tsunami impacts on land cover and related ecosystem service supply in Phang Nga, Thailand.Natural Hazards and Earth System Science13(12):3095‑3111. https://doi.org/10.5194/nhess-13-3095-2013
-
Mapping provisioning ecosystem services at the local scale using data of varying spatial and temporal resolution.Ecosystem Services4:47‑59. https://doi.org/10.1016/j.ecoser.2013.04.001
-
Assessing Landscape Functions with Broad-Scale Environmental Data: Insights Gained from a Prototype Development for Europe.Environmental Management44(6):1099‑1120. https://doi.org/10.1007/s00267-009-9384-7
-
Using expert knowledge in combining green infrastructure and ecosystem services in land use planning: An insight into a new place-based methodology.Landscape Ecology29(8):1361‑1375. https://doi.org/10.1007/s10980-014-0014-2
-
Mapping cultural ecosystem services. In: Burkhard B, Maes J (Eds)Mapping Ecosystem Services.Pensoft Publishers,Sofia,374pp.
-
A multi-criteria approach for an integrated land-cover-based assessment of ecosystem services provision to support landscape planning.Ecological Indicators21:54‑66. https://doi.org/10.1016/j.ecolind.2011.12.010
-
Content analysis: An introduction to its methodology.Sage,Beverly Hills, CA.
-
Rural–urban gradient analysis of ecosystem services supply and demand dynamics.Land Use Policy29(3):521‑535. https://doi.org/10.1016/j.landusepol.2011.07.008
-
Levels of consensus and majority and minority influence.European Journal of Social Psychology32(5):645‑665. https://doi.org/10.1002/ejsp.113
-
Eliciting Expert Knowledge in Conservation Science.Conservation Biology26(1):29‑38. https://doi.org/10.1111/j.1523-1739.2011.01806.x
-
Comparison of techniques for eliciting views and judgements in decision-making.Methods Ecol. Evol.9:54‑63. https://doi.org/10.1111/2041-210X.12940
-
A critical discussion of intraclass correlation coefficients.Statistics in Medicine13(23-24):2465‑2476. https://doi.org/10.1002/sim.4780132310
-
Impacts of land change on biodiversity: making the link to ecosystem services.Current Opinion in Environmental Sustainability5(5):503‑508. https://doi.org/10.1016/j.cosust.2013.05.010
-
Flood regulating ecosystem services—Mapping supply and demand, in the Etropole municipality, Bulgaria.Ecological Indicators21:67‑79. https://doi.org/10.1016/j.ecolind.2011.06.022
-
Likert scales, levels of measurement and the “laws” of statistics.Advances in Health Sciences Education15(5):625‑632. https://doi.org/10.1007/s10459-010-9222-y
-
Participatory assessment and mapping of ecosystem services in a data-poor region: Case study of community-managed forests in central Nepal.Ecosystem Services13:81‑92. https://doi.org/10.1016/j.ecoser.2015.01.007
-
Policy impacts of ecosystem services knowledge.Proceedings of the National Academy of Sciences113(7):1760‑1765. https://doi.org/10.1073/pnas.1502452113
-
Citizen science. In: Burkhard B, Maes J (Eds)Mapping Ecosystem Services.Pensoft Publishers,Sofia,374pp.
-
R: A language and environment for statistical computing.R Foundation for Statistical ComputingURL: https://www.R-project.org/.
-
Who’s in and why? A typology of stakeholder analysis methods for natural resource management.Journal of Environmental Management90(5):1933‑1949. https://doi.org/10.1016/j.jenvman.2009.01.001
-
An assessment method of ecosystem services based on stakeholders perceptions: The Rapid Ecosystem Services Participatory Appraisal (RESPA).Ecosystem Services28:311‑319. https://doi.org/10.1016/j.ecoser.2017.08.002
-
A Deliberative Economics of Ecosystems and Biodiversity.9th Conference of European Society for Ecological Economics ‘‘Advancing Ecological Economics: Theory and Practice” Istanbul.
-
How and where to map supply and demand of ecosystem services for policy-relevant outcomes?Ecological Indicators23:220‑221. https://doi.org/10.1016/j.ecolind.2012.03.025
-
Precisely incorrect? Monetising the value of ecosystem services.Ecological Complexity7(3):327‑337. https://doi.org/10.1016/j.ecocom.2010.04.007
-
Assessment of ecosystem integrity and service gradients across Europe using the LTER Europe network.Ecological Modelling295:75‑87. https://doi.org/10.1016/j.ecolmodel.2014.06.019
-
Évaluation socio-économique du projet LIFE des Alpilles: Impacts sur l’économie de la gestion intégrée des habitats pour les oiseaux d’intérêt communautaire. Master thesis EEET-EDDEE.Université Paris-Saclay. PNR des Alpilles,Paris,103pp.
-
What to map?In: Burkhard B, Maes J (Eds)Mapping Ecosystem Services.Pensoft Publishers,Sofia,374pp.
-
Land Use Policy A land-cover-based approach to assessing ecosystem services supply and demand dynamics in the rapidly urbanizing Yangtze River Delta region.Land Use Policy72(2017):250‑258. https://doi.org/10.1016/j.landusepol.2017.12.051
-
When we cannot have it all: Ecosystem services trade-offs in the context of spatial planning.Ecosystem Serviceshttps://doi.org/10.1016/j.ecoser.2017.10.011
-
Ecosystem services–A tool for sustainable management of human–environment systems. Case study Finnish Forest Lapland.Ecological Complexity7(3):410‑420. https://doi.org/10.1016/j.ecocom.2009.12.002