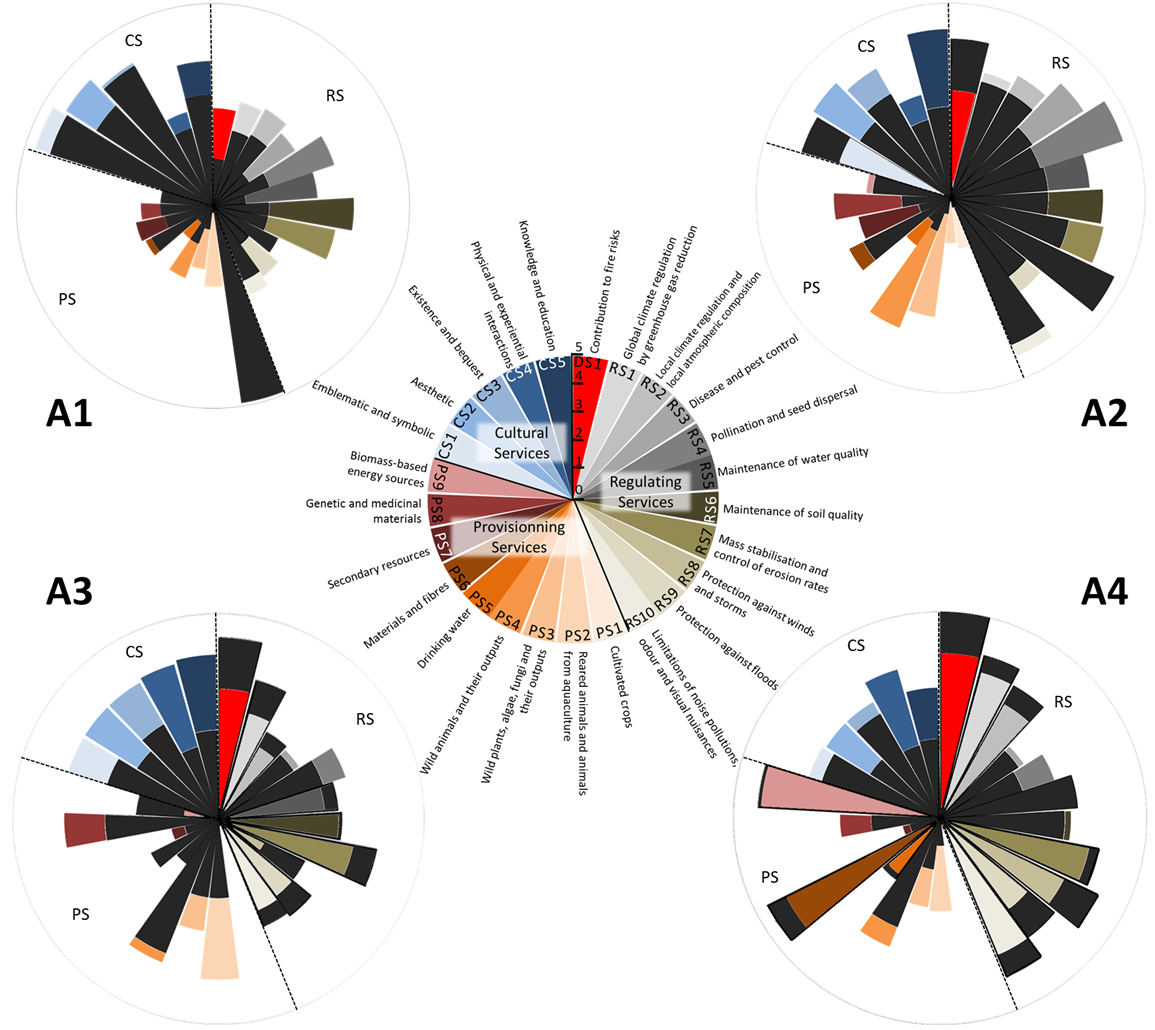
Bundles of ES capacity of the potential Life action impacts.
A1: restoration of a grass layer in olive groves, A2: plantation of multispecies hedgerows, A3: creation of open areas in dense garrigue scrubs by shrub cutting, A4: implementation of good forestry practices with opened forest by shrub cutting and culling. The wedges in the chart are same-shaped: length (radius) indicates the potential capacity of the ET to generate ES, black parts indicate ES provided before the Life actions and colour parts indicate ES provided after the Life actions. When the black part of a wedge exceeds the coloured part, it indicates that the potential is considered higher before than after the Life+ action. If the coloured part exceeds the black part, the potential is considered to be higher after, rather than before, the Life+ action.