|
One Ecosystem :
Ecosystem Service Mapping
|
|
Corresponding author: Ignacio Palomo (ignacio.palomo@bc3research.org)
Academic editor: Hermann Klug
Received: 30 Aug 2017 | Accepted: 19 Dec 2017 | Published: 03 Jan 2018
© 2018 Ignacio Palomo, Louise Willemen, Evangelia Drakou, Benjamin Burkhard, Neville Crossman, Chloe Bellamy, Kremena Burkhard, C. Sylvie Campagne, Anuja Dangol, Jonas Franke, Sylwia Kulczyk, Solen Le Clec'h, Dania Abdul Malak, Lorena Muñoz, Vytautas Narusevicius, Sam Ottoy, Jennifer Roelens, Louise Sing, Amy Thomas, Koenraad Van Meerbeek, Peter Verweij
This is an open access article distributed under the terms of the Creative Commons Attribution License (CC BY 4.0), which permits unrestricted use, distribution, and reproduction in any medium, provided the original author and source are credited.
Citation:
Palomo I, Willemen L, Drakou E, Burkhard B, Crossman N, Bellamy C, Burkhard K, Campagne C, Dangol A, Franke J, Kulczyk S, Le Clec'h S, Abdul Malak D, Muñoz L, Narusevicius V, Ottoy S, Roelens J, Sing L, Thomas A, Van Meerbeek K, Verweij P (2018) Practical solutions for bottlenecks in ecosystem services mapping. One Ecosystem 3: e20713. https://doi.org/10.3897/oneeco.3.e20713
|
|
Abstract
Background
Ecosystem services (ES) mapping is becoming mainstream in many sustainability assessments, but its impact on real world decision-making is still limited. Robustness, end-user relevance and transparency have been identified as key attributes needed for effective ES mapping. However, these requirements are not always met due to multiple challenges, referred to here as bottlenecks, that scientists, practitioners, policy makers and users from other public and private sectors encounter along the mapping process.
New information
A selection of commonly encountered ES mapping bottlenecks that relate to seven themes: i) map-maker map-user interaction; ii) nomenclature and ontologies; iii) skills and background; iv) data and maps availability; v) methods-selection; vi) technical difficulties; and vii) over-simplification of mapping process/output. The authors synthesise the variety of solutions already applied by map-makers and map-users to mitigate or cope with these bottlenecks and discuss the emerging trade-offs amongst different solutions. Tackling the bottlenecks described here is a crucial first step towards more effective ES mapping, which can in turn ensure the adequate impact of ES mapping in decision-making.
Keywords
Ecosystem services, mapping, solutions, spatial analysis, sustainability.
Introduction
Mapping has become one of the most prolific fields within ecosystem service (ES) science (
ES mapping has received much attention because it provides a clear link between ES and spatial planning (
Materials and Methods
Methods
This paper is based on the results of 19 semi-structured questionnaires and the work presented in the thematic session on mapping ES "Solving practical bottlenecks in ecosystem service mapping" that took place during the European Ecosystem Services Partnership (ESP) Conference in Antwerp in 2016. During the thematic session, presenters were asked to discuss their challenges and solutions during the ES mapping processes in which they had participated before and a broad range of ES mapping bottlenecks and practical solutions were covered. After the conference, which included 12 presentations, a semi-structured questionnaire was designed and distributed to the session participants and other ecosystem service mappers and maps-users to collect information on mapping bottlenecks and potential solutions. The questionnaire had three main sections: i) Mapping purpose; ii) Description of the bottleneck faced; iii) How the bottleneck was solved.
Results
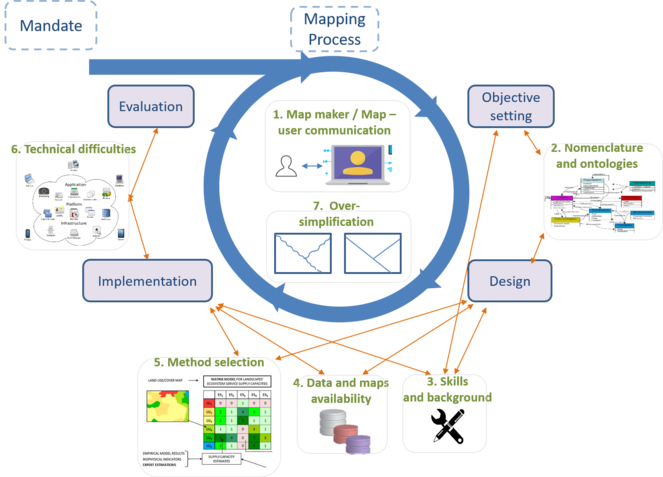
The questionnaire results included bottlenecks faced during ES mapping exercises covering all ecosystem service categories, and multiple spatial scales from local to national, continental and global. Bottlenecks can be encountered in different phases of the mapping process, which we describe here as a circular process in which the tangible outcomes (maps) need to be evaluated and discussed to help to define shared objectives. The landscape planning cycle presents a powerful way to illustrate the mapping process and the ES mapping bottlenecks that are encountered along the different phases (Fig.
Ecosystem services (ES) mapping bottlenecks and solutions offered around them.
|
Bottleneck |
Description |
Solutions for map-makers |
Solutions for map-users |
|
1 Map-maker and map-user communication |
Maps do not match users' needs due to the lack of requirement assessments |
Iterative scientific-practitioner processes, transparent mapping proccesses, PGIS, usability analysis |
Iterative scientific-practitioner processes, communities of practice, visualisation tools |
|
2 Nomenclature and ontologies |
Barriers related to ES classifications and terminology |
ES free-listing based on socio-cultural assessments, classifications based on ontologies, flexible classification systems, pre-testing classifications with diverse stakeholders across scales, linked data standards |
Guidelines to crosswalk across ES classifications |
|
3 Skills and background |
Insufficient training, lack of interdisciplinarity |
Harmonised capacity building, training in mapping platforms, tutorials and guidelines, interdisciplinarity in scientists |
Capacity building, interdisciplinarity in practitioners |
|
4 Data and maps availability |
Lack of adequate data |
PGIS, remote sensing data, citizen science, social media data, use of existing data collected for other purposes, field observations and measurements |
Participate in PGIS and citizen science projects |
|
5 Methods selection |
Difficulties experienced to select adequate methods |
Tiered mapping approaches, decision trees, guidelines for standardised mapping/measurements of ecosystem service |
Platforms for methods documentation and comparison |
|
6 Technical difficulties |
Technical issues related to software, IT-infrastructure, capacity |
User friendly software, better computation power, training, blogs/forums, larger communities of mappers |
Better interfaces for map users, communities of practice |
|
7 Over-simplification |
Hindering of complexity inherent in ES |
Combination of approaches, mapping different value dimensions, co-production of ecosystem services |
Interactive maps, 3D landscape visualisations, dynamic visualisation, thematic maps, portfolio of maps |
Bottleneck 1. Map-maker map-user communication
Refers to cases where the mapped outputs produced do not meet the end user needs because of poor communication between the map-maker and the map-user. This can occur when the end user's data requirements and decision-making process are not fully understood by the map-maker. It is also related to communicating uncertainty and to transferring the message accurately in a way that is relevant but understandable for end users.
Science-policy iterative processes and capacity building have been suggested as means to improve map-maker to map-user communication and to solve the ES implementation gap (
Researchers have attempted to solve communication bottlenecks through communities of practice and sharing platforms for ES such as the ESP Visualisation tool (
Bottleneck 2. Nomenclatures and ontologies
Refers to mapping barriers encountered due to differences in the use and understanding of ES classifications and terminology (such as the Common International Classification for Ecosystem Services (CICES), The Millennium Ecosystem Assessment (MEA), The Economics of Ecosystems and Biodiversity (TEEB), The Final Ecosystem Good and Services Clasification (FEGS), or the classification from the Intergovernmental Science-Policy Platform on Biodiversity and Ecosystem Services (IPBES)).This also includes the trade-off between the standardisation or interoperability of ES classifications and context adequacy, as ES can have different meanings depending on the framework used for conceptualising them (e.g. ES potential vs. supply vs. flow vs. demand; intermediate vs. final ES; different human-nature worldviews) and the mapping contexts (e.g. spatial scale of assessment). This bottleneck also refers to challenges that arise when ES classifications hinder the expression of ES values that stakeholders hold (
Using ES free-listing (bottom-up classifications), flexible classification systems and pre-testing classifications with diverse stakeholders across scales have been widely applied to overcome these difficulties (
A combination of existing and emerging classifications has been applied as well.
Stronger and more detailed socio-cultural assessments that connect the state of biodiversity with human well-being to elicit stakeholders´ values are still needed to facilitate the adequate understanding of multiple value types. Several ontological concepts such as the SERONTO ontology (
Bottleneck 3. Skills and background
Refers to the skills and the disciplinary background of the people involved in the mapping process as map-makers or map-users. It is related to insufficient or unsustainable training but also to the incorporation of multiple disciplines within interdisciplinary science such as ES science and to the selection of participants for expert-based or PGIS mapping exercises. Spatial analysis and data visualisation are complex processes requiring a wide range of expertise from the thematic background and understanding the user requirements, to choosing the optimal methodology, selecting the appropriate software, having the skills to analyse data and designing a map. For example, mappers using online participatory mapping surveys have reported that the lack of intuitive controls has made the mapping complex and might have biased the answers towards people with higher computational skills (Muñoz et al., in prep.).
Some of the most widely used platforms for mapping ES, such as InVEST and ARIES, have long benefited from the provision of intensive training opportunities for map makers, which are an essential part for the distribution of these tools and for which significant resources need to be allocated
Regarding background-related skills, transdisciplinary education programmes and using systematic methods for stakeholder (map-makers and map-users) selection that account for multiple disciplines are needed. A user-friendly design of mapping methods, video tutorials and a section of Frequently Asked Questions (FAQ) have been applied to better guide mappers through the mapping process and to match users´ skills.
Bottleneck 4. Data and maps availability
Refers to limited availability or access to accurate, trustworthy and affordable data in the required format and at an adequate spatial or temporal resolution for the entire area of interest and to the availability of maps for map-users. ES maps availability is still a very significant constraint that practitioners face. A recent survey amongst 60 users of ES maps in sub-Saharan Africa found that only 27% of respondents had adequate ES data
In order to map ES, harnessing expert knowledge (e.g. through Bayesian Belief Networks, ES matrix/spreadsheet models or PGIS) has been widely applied in data-scarce regions (e.g.
Some studies have opted to combine different methods in an attempt to tackle the scarcity of adequate data. In a study in South-Eastern Africa (Willemen et al., 2017), maps were derived from a combination of model-based maps and PGIS data in order to identify ES hotspots where these outcomes of the two approaches coincided in space. In some cases, despite the loss of information, simplification or generalisation can be a way forward to circumvent the lack of data
Bottleneck 5. Methods' selection
Refers to the difficulties experienced to select adequate methods because the differences amongst the multiple methodologies available and the resources needed to apply them is often unclear.
Applying integrated mapping steps (“tiered approaches”) in which first the aim of mapping is defined, then the variables needed are identified and finally the method is selected, has been proposed for the identification and selection of methods (
Several decision-making online platforms exist that allow the user to compare the different tools. For instance, the IPBES catalogue of policy support tools (in development), the UK-NEAT toolkit (http://neat.ecosystemsknowledge.net/), the ValuES platform (http://www.aboutvalues.net), The Ecosystems Knowledge Network’s Tool Assessor (http://ecosystemsknowledge.net/resources/guidance-and-tools/tools/tool-assessor), the Ecosystem-Based Management tools platform (https://ebmtoolsdatabase.org) and the many methodological decision trees in the Guidance to ES Assessment (http://www.guidetoes.eu). For the academic community, studies comparing model performance at catchment scale are available (e.g.
Bottleneck 6. Technical difficulties
Refers to technical issues experienced in the mapping process related to software or hardware constraints. GIS and spatial models, used to map ES, need to represent complex systems and so often require the use of large, complex datasets and intensive analysis. Technical difficulties include aspects such as how to digitise analogue participatory maps, count overlapping polygons, handling and analysing complex remote sensing data from different sources or developing an online platform for data gathering. Some tools are extensions to commercial, closed-code software (e.g. ArcGIS) to which not all users can readily or affordably access, thus restricting the community of users.
Multiple solutions to this bottleneck exist, such as user-friendly software development (including Open Source initiatives such as QGIS and QUICKScan), training through GIS courses, fast-evolving computation power and capabilities to store and analyse ‘big data’. Technical difficulties are often solved through openly accessible online blogs and forums. Growing communities of users can also be useful to share solutions to technical problems.
Bottleneck 7. Over-simplification
Refers to generalisation, as a key cartographic technique, that facilitates the representation of complex realities (
Mapping ES supply, flow and demand (
Combinations of different methods such as field observations, PGIS, satellite images or model-based data to map ES have been suggested to obtain information from different sources and of different qualities that can overcome the over-simplification and help to reduce uncertainty (
Discussion
Seven common bottlenecks have been presented that scientists and practitioners face when mapping ES. Despite not being exhaustive, it is considered that this classification is the first to contain the most common challenges faced in ES mapping to date. Even though various and diverse bottlenecks exist, there is as well a wide diversity of solutions. Some solutions demand more effort, time and resources than others, but for many cases simple solutions are available at hand for most ES mapping scientists and practitioners. A limitation of this study is that most respondents of the semi-structured questionnaire focused on map-making and have less experience in informing policy- and decision-making with ES maps as other ES practitioners. Recent research shows that current ecosystem service studies do not provide the adequate information that decision-makers need to make instrumental decisions (
Several bottlenecks are inter-related, which can lead to trade-offs and synergies amongst different solutions. For example, communication between map-makers and map-users (bottleneck 1) relates to the oversimplification challenge (bottleneck 7) and ways to communicate complex information efficiently, revealing a trade-off between the two. In some cases, end-users might require a less complex mapping output for their decision-making, which might fail to give a good representation of reality. A trade-off exists between harmonising context specificities with standardised approaches and using context-adapted approaches, that become clear with the issue of ES classifications. It is still to be seen if less strictly delineated classification systems can help to cope or solve this issue or if the use of linking data standards can help deviate from this issue. In other cases, solving one bottleneck (e. g. skills and background) can help through the whole mapping process.
Technology might help to solve some of the bottlenecks identified, especially with the help of cloud computing, data standards, remotely sensed data and software development. However, continuous communication and interaction with map-users, open access data and tool sharing and capacity building hold great potential for solving many of the bottlenecks presented here. Larger and more active integrative communities of map-makers and map-users are cornerstones for solving these challenges and for identifing others. Creative thinking, such as the use of social media data to map ES, can also help overcome several of the identified bottlenecks. Certainly, no magic or one-fits-all solutions exist and obtaining robust and end-user relevant maps demands a considerable amount of resources. Importantly, there is a danger of over-simplification while using ES maps that needs to be solved with high transparency, clear documentation of metadata and maps of uncertainties, portfolios of maps, multidimensional mapping and thorough dedicated communication with the end-users with the use of available expertise (e.g. there are experts dedicated in science communication or visualisation who are rarely involved in the process).
Expectations regarding the impact of ES maps and mapping process are high. In the near future, it can be expected that ES mapping will support a more sustainable and equitable use of nature and landscape planning, with as little uncertainty as possible and increased awareness of our dependence on nature. For that to happen, the ES mapping community could focus on dealing with the challenges presented here. To fully realise the potential of ecosystem service maps for sustainability, the bottlenecks presented above need to be solved first.
Conclusions
Mapping ES has become one of the most prolific fields within ES science. Despite all progress made, several challenges still remain for map-makers and map-users through the complex process of mapping ES and informing policy with ES maps. Here a classification is presented of seven mapping bottlenecks and related solutions identified by experts to improve : i) map-maker map-user interaction; ii) nomenclature and ontologies; iii) skills and background; iv) data and maps availability; v) methods-selection; vi) technical difficulties; and vii) over-simplification of mapping process/output. The synergies and trade-offs amongst solutions identified here can help to enhance the impact of the ES mapping community and to fully realise the potential of ES maps to inform decision-making.
Acknowledgements
The authors wish to thank the participants of the “Solving practical bottlenecks in ecosystem service mapping” session at the European ESP Conference 2016 in Antwerp. They contributed substantially to the bottlenecks’ identification and description. We thank two reviewers for their suggestions during the review process.
Funding program
IP was funded by the Juan de la Cierva Formación grant from the Spanish Ministry of Economy and Competitiveness (FJCI-2014-20236). BB, NC and CSC were funded by the ESMERALDA project, which receives funding from the European Union’s Horizon 2020 research and innovation programme under grant agreement No 642007.
References
- Design and impact assessment of watershed investments: An approach based on ecosystem services and boundary work.Environmental Impact Assessment Review62:1‑13. https://doi.org/10.1016/j.eiar.2016.08.001
- Applying ecosystem services indicators in landscape planning and management: the ES-in-Planning framework.Ecological Indicators61:100‑113. https://doi.org/10.1016/j.ecolind.2015.03.029
- Airborne laser-guided imaging spectroscopy to map forest trait diversity and guide conservation.Science355(6323):385‑389. https://doi.org/10.1126/science.aaj1987
- Evaluating alternative methods for biophysical and cultural ecosystem services hotspot mapping in natural resource planning.Landscape Ecology32(1):77‑97. https://doi.org/10.1007/s10980-016-0430-6
- Mapping ecosystem service capacity, flow and demand for landscape and urban planning: a case study in the Barcelona metropolitan region.Land Use Policy57:405‑417. https://doi.org/10.1016/j.landusepol.2016.06.006
- A spatial framework for targeting urban planning for pollinators and people with local stakeholders: A route to healthy, blossoming communities?Environmental Research158:255‑268. https://doi.org/10.1016/j.envres.2017.06.023
- Mapping Ecosystem Services.Pensoft Publishers, Sofia
- Mapping ecosystem service supply, demand and budgets.Ecological Indicators21:17‑29. https://doi.org/10.1016/j.ecolind.2011.06.019
- Expert-based ecosystem services capacity matrices: Dealing with scoring variability.Ecological Indicators79:63‑72. https://doi.org/10.1016/j.ecolind.2017.03.043
- Mapping multiple ecosystem services indicators: Toward an objective-oriented approach.Ecological Indicators69:508‑521. https://doi.org/10.1016/j.ecolind.2016.05.021
- A blueprint for mapping and modelling ecosystem services.Ecosystem Services4:4‑14. https://doi.org/10.1016/j.ecoser.2013.02.001
- Open Data Strategy draft.version9:1‑32.
- When ecosystems and their services are not co-located: oceans and coasts.ICES Journal of Marine Sciencehttps://doi.org/10.1093/icesjms/fsx026
- A visualization and data-sharing tool for ecosystem service maps: Lessons learnt, challenges and the way forward.Ecosystem Services13:134‑140. https://doi.org/10.1016/j.ecoser.2014.12.002
- Edsall R, Barbour L, Hoffman J (2015) Complementary Methods for Citizen Mapping of Ecosystem Services: Comparing Digital and Analog Representations. Lecture Notes in Geoinformation and Cartography. https://doi.org/10.1007/978-3-319-17738-0_20
- Assessing linkages between ecosystem services, land-use and well-being in an agroforestry landscape using public participation GIS.Applied Geography74:30‑46. https://doi.org/10.1016/j.apgeog.2016.06.007
- Assessment of grassland use intensity by remote sensing to support conservation schemes.Journal for Nature Conservation20(3):125‑134. https://doi.org/10.1016/j.jnc.2012.02.001
- Collaborative mapping of ecosystem services: The role of stakeholders׳ profiles.Ecosystem Services13:141‑152. https://doi.org/10.1016/j.ecoser.2014.11.006
- Characterizing Users' Visual Analytic Activity for Insight Provenance.Information Visualization8(1):42‑55. https://doi.org/10.1057/ivs.2008.31
- A tiered approach for mapping ecosystem services.Ecosystem Services13:16‑27. https://doi.org/10.1016/j.ecoser.2014.10.008
- Challenges in integrating the concept of ecosystem services and values in landscape planning, management and decision making.Ecological Complexity7(3):260‑272. https://doi.org/10.1016/j.ecocom.2009.10.006
- Common international classification of ecosystem services (CICES, Version 4.1).European Environment Agenc,33pp.
- Haines‐Young R, Potschin M (2014) Typology/Classification of Ecosystem Services. In: Potschin M, Jax K (Eds) OpenNESS Ecosystem Services Reference Book. URL: http://www.openness‐project.eu/library/reference‐book
- “Maps have an air of authority”: Potential benefits and challenges of ecosystem service maps at different levels of decision making.Ecosystem Services4:25‑32. https://doi.org/10.1016/j.ecoser.2012.11.003
- Ecosystem services visualization and communication: A demand analysis approach for designing information and conceptualizing decision support systems.Ecosystem Services13:173‑183. https://doi.org/10.1016/j.ecoser.2015.02.006
- Shedding light on the usability of ecosystem services–based decision support systems: An eye-tracking study linked to the cognitive probing approach.Ecosystem Services19:65‑86. https://doi.org/10.1016/j.ecoser.2016.04.002
- Ecosystem services in tourism and recreation. Revisiting the classification problem.Ekonomia i Środowisko4(51):84‑92.
- Stakeholder perceptions of grassland ecosystem services in relation to knowledge on soil fertility and biodiversity.Regional Environmental Change11(4):791‑804. https://doi.org/10.1007/s10113-011-0214-0
- Valuing ecosystem services in community-based landscape planning: introducing a wellbeing-based approach.Landscape Ecology29(8):1347‑1360. https://doi.org/10.1007/s10980-014-0045-8
- An indicator framework for assessing ecosystem services in support of the EU Biodiversity Strategy to 2020.Ecosystem Services17:14‑23. https://doi.org/10.1016/j.ecoser.2015.10.023
- Trade-offs across value-domains in ecosystem services assessment.Ecological Indicators37:220‑228. https://doi.org/10.1016/j.ecolind.2013.03.003
- Uncovering Ecosystem Service Bundles through Social Preferences.PLoS ONE7(6):e38970. https://doi.org/10.1371/journal.pone.0038970
- The bioenergy potential of Natura 2000 - a synergy between climate change mitigation and biodiversity protection.Frontiers in Ecology and the Environment14(9):473‑478. https://doi.org/10.1002/fee.1425
- Mapping social values of ecosystem services: What is behind the map?Ecology and Society21(3). https://doi.org/10.5751/es-08676-210324
- Assessing top- and subsoil organic carbon stocks of Low-Input High-Diversity systems using soil and vegetation characteristics.Science of The Total Environment589:153‑164. https://doi.org/10.1016/j.scitotenv.2017.02.116
- Palomo I, Felipe-Lucia M, Bennett E, Martín-López B, Pascual U (2016) Disentangling the Pathways and Effects of Ecosystem Service Co-Production. Advances in Ecological Research. https://doi.org/10.1016/bs.aecr.2015.09.003
- National parks, buffer zones and surrounding lands: mapping ecosystem service flows.Ecosystem Services4:104‑116. https://doi.org/10.1016/j.ecoser.2012.09.001
- Valuing nature’s contributions to people: the IPBES approach.Current Opinion in Environmental Sustainability7‑16. https://doi.org/10.1016/j.cosust.2016.12.006
- Spatial patterns of cultural ecosystem services provision in Southern Patagonia.Landscape Ecology31(2):383‑399. https://doi.org/10.1007/s10980-015-0254-9
- From supply to social demand: a landscape-scale analysis of the water regulation service.Landscape Ecology29(6):1069‑1082. https://doi.org/10.1007/s10980-014-0032-0
- Future impacts of drivers of change on wetland ecosystem services in Colombia.Global Environmental Change44:158‑169. https://doi.org/10.1016/j.gloenvcha.2017.04.001
- The social side of spatial decision support systems: Investigating knowledge integration and learning.Environmental Science & Policy76:177‑184. https://doi.org/10.1016/j.envsci.2017.06.015
- Extracting cross sections and water levels of vegetated ditches from LiDAR point clouds.International Journal of Applied Earth Observation and Geoinformation53:64‑75. https://doi.org/10.1016/j.jag.2016.08.003
- Making research relevant? Ecological methods and the ecosystem services framework.Earth's Future5(7):664‑678. https://doi.org/10.1002/2016ef000501
- Notes from the field: Lessons learned from using ecosystem service approaches to inform real-world decisions.Ecological Economics115:11‑21. https://doi.org/10.1016/j.ecolecon.2013.07.009
- Lessons learned for spatial modelling of ecosystem services in support of ecosystem accounting.Ecosystem Services13:64‑69. https://doi.org/10.1016/j.ecoser.2014.07.003
- Comparing strengths and weaknesses of three ecosystem services modelling tools in a diverse UK river catchment.Science of The Total Environment584–585:118‑130. https://doi.org/10.1016/j.scitotenv.2016.12.160
- Possibilities of using the concept of ecosystem services at the regional level in experts’ opinions.Ekologia I Środowisko1(60):81‑91.
- Spatial indicators for the assessment of ecosystem services: Providing, benefiting and connecting areas and landscape metrics.Ecological Indicators21:80‑88. https://doi.org/10.1016/j.ecolind.2012.02.013
- Continental-scale quantification of landscape values using social media data.Proceedings of the National Academy of Sciences113(46):12974‑12979. https://doi.org/10.1073/pnas.1614158113
- Use of demand and spatial flow in prioritizing areas for ecosystem services.Conservation Biologyhttps://doi.org/10.1111/cobi.12872
- QUICKScan as a quick and participatory methodology for problem identification and scoping in policy processes.Environmental Science & Policy66:47‑61. https://doi.org/10.1016/j.envsci.2016.07.010
- A methodology for adaptable and robust ecosystem services assessment.PloS one9(3):e91001. https://doi.org/10.1371/journal.pone.0091001
- A comparison of ecosystem services mapping tools for their potential to support planning and decision-making on a local scale.Ecosystem Services15:75‑83. https://doi.org/10.1016/j.ecoser.2015.07.007
- SERONTO: A Socio-Ecological Research and Observation Ontology: the core ontology: A Long-Term Biodiversity, Ecosystem and Awareness Research Network.FAO
- Do ecosystem service maps and models meet stakeholders’ needs? A preliminary survey across sub-Saharan Africa.Ecosystem Services18:110‑117. https://doi.org/10.1016/j.ecoser.2016.02.038
- Using social media to measure the contribution of red list species to the nature-based tourism potential of African protected areas.PLOS ONE10(6):e0129785. https://doi.org/10.1371/journal.pone.0129785
- Editorial: Best practices for mapping ecosystem services.Ecosystem Services13:1‑5. https://doi.org/10.1016/j.ecoser.2015.05.008
- Identifying ecosystem service hotspots for targeting land degradation neutrality investments in south-eastern Africa.Journal of Arid Environmentshttps://doi.org/10.1016/j.jaridenv.2017.05.009
- Are ecosystem service studies presenting the right information for decision making?Ecosystem Services25:128‑139. https://doi.org/10.1016/j.ecoser.2017.03.002