|
One Ecosystem :
Review Article
|
|
Corresponding author: Till Fügener (t.fuegener@ioer.de)
Academic editor: Joachim Maes
Received: 19 Apr 2022 | Accepted: 15 Jun 2022 | Published: 06 Jul 2022
© 2022 Patrycia Brzoska, Till Fügener, Uta Moderow, Astrid Ziemann, Christoph Schünemann, Janneke Westermann, Karsten Grunewald, Lisa Maul
This is an open access article distributed under the terms of the Creative Commons Attribution License (CC BY 4.0), which permits unrestricted use, distribution, and reproduction in any medium, provided the original author and source are credited.
Citation:
Brzoska P, Fügener T, Moderow U, Ziemann A, Schünemann C, Westermann J, Grunewald K, Maul L (2022) Towards a web tool for assessing the impact of climate change adaptation measures on heat stress at urban site level. One Ecosystem 7: e85559. https://doi.org/10.3897/oneeco.7.e85559
|
|
Abstract
In view of the increased frequency of heat events and their negative effects, principally in cities, many scholars and practitioners are focusing on ways of adapting to climate change. The urban population and, especially, vulnerable groups, are now being affected to such a degree that adaptation measures are deemed necessary. Clearly, the planning and implementation of such measures are dependent on municipal resources. Tools can greatly assist in the planning of such measures at urban site level. This article provides a systematic review of the tools currently available for planning and implementing climate change adaptation measures in cities. The results offer a comprehensive overview of existing planning tools, which can also serve as a handy look-up document for urban planners searching for such tools. We find that many of these tools require considerable improvement and optimisation. For example, our findings demonstrate that outputs may be overly generalised, often there is no way of entering site-specific information while additional co-benefits (e.g. ecosystem services) are ignored. By analysing selected tools, we pinpoint and discuss requirements for future planning tools. In particular, we present a concept for a tool currently under development which is designed to assist in the planning and implementation of heat adaptation measures at diverse (small) spatial scales. The advantages of this tool are that it can assess the indoor thermal situation in addition to outdoor conditions, thereby providing comprehensive information on the suitability of adaptation measures. Furthermore, decision-making processes could benefit from some estimation of the likely co-benefits (here, ecosystem services) if proposed adaptation measures were implemented.
Keywords
tool, climate change adaptation measures, urban heat stress, site level, model areas, urban planning
Introduction
The recently published IPCC Sixth Assessment Report highlighted once again the increasing pressures that cities are facing due to global climate change. With very high confidence, the panel states that “cities intensify human-induced warming locally, and further urbanization together with more frequent hot extremes will increase the severity of heatwaves” (
Increasing urbanisation also leads to increased thermal stress on residents. Heat stress is one of the most significant repercussions of climate change on the well-being and health of city residents (
Clearly, adaptation measures are required to ensure the preservation and protection of urban ecosystems and a good quality of life for local residents. Adaptation to climate change has been defined as the “process of adjustment to actual or expected climate and its effects. In human systems, adaptation seeks to moderate or avoid harm or exploit beneficial opportunities. In some natural systems, human intervention may facilitate adjustment to expected climate and its effects” (
This study investigates various tools designed to facilitate the planning and implementation of climate change adaptation measures. Here, we understand the term “tool” in its standard usage in the field of informatics, namely a small programme that performs specific tasks for an operating system or application programme. Generally, tools are easy to understand and require input data to produce output data. In the following, we use the term “tool” to refer to a digital tool that aids the planning and implementation of climate change adaptation measures, as well as supporting decision-making by identifying potential vulnerabilities and suggesting possible adaptation measures, optimally by means of visualisation and quantified values. In this way, such tools should not only simplify the identification of measures (Which measures are most suitable?), but also support the associated decision-making processes by providing further argumentation for their realisation. Ideally, tools should also be able to identify and communicate additional co-benefits of measures in addition to the climate change adaptation effect, for example, the simultaneous promotion of different ES through the implementation of certain measures (
Our review of existing planning tools at the national (for Germany) and international level is conducted on the basis of diverse criteria. As such tools are designed to aid planning and the realisation of appropriate measures, we consider the target group to be urban planners employed by professional practices, as well as municipal authorities. The analysis aims to answer the following questions: Which optimisation potentials can be determined for existing tools and which research gaps can be identified? After presenting and discussing the results of the analysis, we offer some general recommendations for tool development. Most existing tools for the reduction of urban heat reveal a lack of micro-climate simulations or are poorly transferable to other regions. Of course, such tools always have to make a trade-off between transferability and accuracy. These findings will be further developed and reflected in the creation of a dedicated tool within the framework of the project “HeatReslientCity II” (HRC II, http://heatresilientcity.de/en/). At the end of the paper, we present a concept for such a web tool designed to support heat adaptation planning at urban site scale (here: spatial resolution level smaller than 20 m, after
Methods
The review and assessment of existing planning tools consisted of four steps, illustrated in Fig.
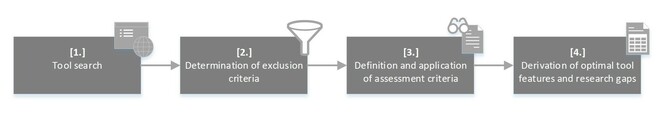
Tool search (working step 1)
Assuming that urban planners (our target group) are likely to seek tools for their daily work using a search engine rather than via scientific papers, we decided to use the world’s most popular such engine for our study, namely Google search (
A systematic Google search was conducted from September to October 2020. German and English search terms were used to locate national and international tools. During each search, the individual results were screened to see if a relevant tool was listed on the indicated web page. Here, the first step was to check for the terms “tool” or “toolbox”. Then we assessed whether the “tool” dealt with heat stress and respective adaptation measures in the city. While this was true of some tools, others were described as being designed for other fields such as “energy” or “rainwater management”; in such cases, they were excluded from further analysis. If a tool were merely referenced, the provided link (or Google search) was used to search for the tool until the correct website was found. If several tools were listed on a resulting website or if reference were made to further tools, these were all subject to an immediate assessment and, where relevant, included in the analysis. Due to the high number of results, with frequent duplications as well as irrelevant information, the search process was declared finished for each search term after Google issued the message: “In order to show you the most relevant results, we have omitted some entries very similar to the […] already displayed. If you like, you can repeat the search with the omitted results included” (see Table
Overview of terms used for the Google search, the number of pages indicated by Google as most relevant and the total number of results.
|
Search terms |
Termination of search after Google displayed the most relevant results |
Total number of results indicated by Google |
|
“Tool Hitze resiliente Stadt” [engl. tool heat resilient city] |
Search results ended on p. 11 |
~ 276,000 |
|
“Tool Klimaanpassung Stadt” [engl. tool climate change adaptation city] |
Search results ended on p. 13 |
~ 27,400 |
|
“Tool klimaresiliente Stadt” [engl. tool climate change resilient city] |
Search results ended on p. 14 |
~ 14,700 |
|
“Tool hitzeangepasste Stadt” [engl. tool heat adapted city] |
Search results ended on p. 12 |
~ 1,500 |
|
“Tool heat resilient city” |
Search results ended on p. 21 |
~ 20,200,000 |
|
“Tool heat adaptation city” |
Search results ended on p. 11 |
~ 45,100,000 |
In addition, a literature search was conducted on articles published on the ISI Web of Science website using the search terms “heat resilient city” AND “tool” and “heat adaptation city” AND “tool”. Neither of these searches resulted in additional tools for analysis.
Determination of exclusion criteria (working step 2)
The next step was to determine exclusion criteria to refine the search results and locate the tools relevant to the topic. If one of these criteria were found to apply to a tool, it was excluded from further analysis. The exclusion criteria are listed and briefly explained in Table
|
Exclusion criteria |
Short explanation |
|
(1) No city reference |
Tools should focus on cities. |
|
(2) Wrong topic |
Tools should relate to the topic of heat. |
|
(3) Insufficiently described |
There is insufficient information for a further analysis. |
|
(4) Still under development |
The tool is still under development. |
|
(5) No city-, district- or site-level * |
The tool cannot be applied at the city-, district or site-level. |
|
(6) No tool |
Not a tool in the sense of the adopted definition (see Introduction). |
|
(7) Outdated (no functionality) |
The tool does not work/the website is no longer available. |
|
(8) No climate change adaptation measures |
The tool does deal with heat stress and climate change adaptation measures. |
* Derived from
Definition and application of assessment criteria (working step 3)
After determining the exclusion criteria, it was necessary to define assessment criteria. These were used to evaluate the performance of the selected tools. Clearly, the criteria had to reflect those features that a tool must possess for everyday use in planning heat adaptation measures at city, district or site level. To this end, we chose the list of criteria for a useful planning tool suggested by two focus groups of 15 participants active in several fields of urban planning and decision-making, as recorded in the study by
|
Assessment criteria |
Description |
|
Free of charge |
For everyday use, it is necessary that a tool be free of charge and freely available to everyone. If this is the case, a tool was rated “++”; otherwise “-”. |
|
Expertise |
Since authorities such as city planning departments often lack expertise in a wide range of topics ( |
|
Scale |
According to |
|
Purpose of the tool |
During the analysis, we determined that the criterion of scale does not give insight into the level of detail offered by a tool. Therefore, this additional criterion was introduced. Tools which analyse the microclimate and the effectiveness of measures were rated “++”; tools that merely record the effectiveness of measures were rated “+”; tools that only carry out a rough screening were rated “-”. |
|
Vulnerability |
An optimal planning tool should include a vulnerability analysis. Here, this means an assessment of the current stress situation in the project area, i.e. we considered whether a tool tests the stress situation in any way. This was evaluated using: a) socio-economic data; and b) the presence of areas of heat stress or some kind of thermal stress in terms of higher temperature. The latter is considered more important for the analysis. A tool which covers both categories was rated “++”; if only one category is covered, temperature indices were preferably rated with “+”, socio-economic data was rated with “0”; no coverage of vulnerability was rated “-”. |
|
Factors of local heat stress |
To get an impression of the extent of the stress situation due to excess heat, we recorded whether intensifying factors (e.g. during night-time hours: building design and for daytime hours: soil sealing) and heat reducing factors (subdivided into high vegetation, low vegetation and water elements) were considered during the tool development or directly in the tool itself. Optimally, a detailed analysis of the climatic situation should encompass all factors. The recording of all factors was rated “++”; the recording of all factors, except water elements was rated “+”; the exclusion of the factors water elements and high vegetation with “0”; and no recording of factors was rated “-”. |
|
Subject of quantification |
In addition to the purpose of the tool, this criterion allows an assessment of the scope of the evaluation. Clearly, a planning tool designed to map measures of heat-resilient climate change adaptation should quantify vulnerability and measure the degree of effectiveness. While the measuring of effectiveness is preferred over vulnerability in our assessment due to the focus on mapping measures, a vulnerability assessment is also considered desirable. Furthermore, it was recorded here whether a tool offers recommendations for measures, even if this does not necessarily involve quantification (therefore listed in brackets). In order to be subject to further analysis, a tool had to recommend adaptation measures. Thus, tools meeting all three criteria were rated “++”; those offering an analysis of measure effectiveness and giving recommendations were rated “+”; those with an assessment of vulnerability and measure recommendations were rated “0.” |
|
Quantification |
|
|
Scenarios |
The modelling of scenarios in a decision-support tool can help compare planning states as well as assist in deriving the best possible measures. In the best case, the current state is represented in addition to planning scenarios. Tools with this ability were rated “++”. Tools that merely represent planning states while neglecting the current state are usually orientated on a “worst case” scenario; these were rated “0”. Since our research focus is on tools in the field of planning, representation of only the actual state is considered insufficient and rated “-”. While the modelling of RCP scenarios[1] is considered a useful function, this is only listed for information purposes and was disregarded in the evaluation. |
|
Transferability |
As each study area is subject to local conditions, these will clearly affect the impact of adaptation measures. While tools are usually developed for specific project areas and thus specific conditions, transferability to other geographic and socio-economic areas is often possible using benefit transfer methods. Here, it is often very helpful to consider the methodology behind a tool. A tool which demands local geodata for its application (thus indicating greater reliability of results) was rated “++”. Tools that are easy to generalise using benefit transfer methods, but which can be adapted to local conditions using local data, were rated “+”. Tools relying solely on benefit transfer methods were rated “0”; those developed for specific areas and which are not transferable to other regions were rated “-”. |
|
Time requirement |
Since a tool should be designed for everyday use in planning, it is helpful if only a short training period is needed and results can be obtained quickly. In this sense, tools that can be used immediately, i.e. with no training period and which give speedy results were rated “++”; tools with a certain training period, but fast output of results were rated “+”; those with increased time required for data acquisition or processing were rated “-”. |
[1] RCP = Representative Concentration Pathway; RCP scenarios are based on multi-gas emission scenarios and are labelled to reflect a possible range of radiative forcing values in the year 2100 relative to pre-industrial values.
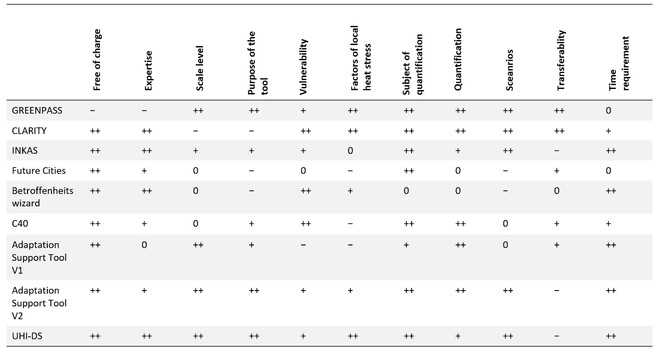
A 4-point scale was used to evaluate the performance of the selected tools according to each assessment criteria. These ratings were: “++” for very suitable, “+” for suitable, “0” for acceptable and “-” for unsuitable as a decision-support tool in the sense of this study. For additional information gathering on the selected tools, we consulted the respective manuals, websites, press releases, video tutorials and scientific publications on the methods or case studies.
Derivation of optimal tool features and research gaps (working step 4)
Based on the analysis and comparison of the different tools, we then identified optimisation potentials, as well as further research gaps. These will be detailed in the discussion section.
Results
A total of 58 tools were identified by the search process (listed in Suppl. material
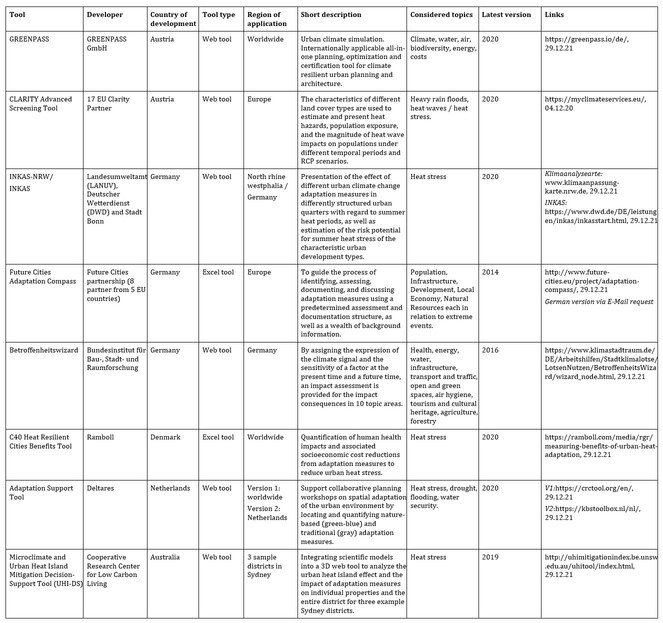
General information on the selected tools.
Sources for further analyses: Greenpass (
It is striking that seven of the eight tools are from Europe (see Fig.
Fig.
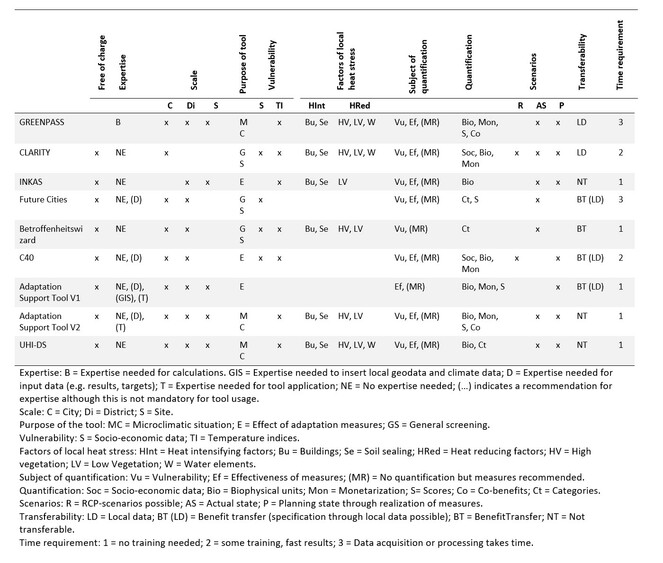
Fig.
Discussion & optimal tool features
Tool assessment
All tools (apart from GREENPASS) are available free of charge, making them suitable and affordable for quick assessment (see Fig.
As the tools were mostly developed for specific areas, they have extremely limited transferability (e.g. UHI-DS). Those tools designed for a wider applicability usually employ benefit transfer or spatial proxy methods, giving generalised results and reducing the reliability of outcomes (
With the exception of CLARITY, all tools were designed to investigate “heat stress” seen as the impact on the human well-being and health (along with some other issues). However, only three tools are able to assess the microclimatic situation, namely GREENPASS, Adaptation Support Tool V2 and the UHI-DS tool, AST 2 and UHI-DS, but are not transferable to other cases. In Fig.
On the other hand, almost all tools attempt to assess vulnerability to thermal stress, albeit in very different ways. One exception here is AST 1, which does not capture vulnerability via meteorological variables or socio-economical values. Like the C40 tool, it cannot represent the actual climatic situation and, thus, only analyses the effectiveness of measures in comparison to a worst-case scenario. While the INKAS tool also only considers the effect of measures, the user has the option to estimate the actual situation via spatial analysis diagrams. Apart from Adaptation Compass and Betroffenheitswizard, all tools allow the planning status to be altered, which is very useful for planning decisions and to derive optimal solutions.
In general, it is helpful for planners if comprehensive outputs are offered, especially monetary values, in order to convince investors and decision-makers of the importance of implementing measures (
In almost all cases, the descriptions of the tools stated that they were developed especially for urban planners to support the decision-making process. Usually, (several) research institutions were involved in the development over a lengthy period. Consequently, the tools all show a high degree of sophistication. Unfortunately, most tools do not address the microclimate, which is so crucial for analysing the impact of heat stress on the well-being and health of urban residents. The accompanying documentation to the tools repeatedly points out that they cannot replace detailed urban climate simulations based on local data. Here the question arises whether detailed studies for smaller project areas are, in fact, necessary.
Optimal tool features
In the following, our analysis results are used to pinpoint those elements which tools must possess in order to be useful to planners.
Currently, many tools neglect the microclimate. While temperature indices can be found in almost all examined tools, these are generally only used to roughly record the overall situation and are not localised, for example, via geodata. Clearly, the use of geodata can strengthen the scientific basis of results and save time in data gathering (
The consideration of small site scales is particularly useful when planning heat adaptation measures. Many of the tools presented here, however, operate on other scales, such as city or district level (see Fig.
In addition, the recommended measures in the tools are presented in a generalised way. This can foster user engagement with the measures and, thus, constitute a learning effect. However, it can also lead to the user feeling overwhelmed, as it becomes difficult to determine which measure makes the most sense and which is most effective for any particular type of urban structure. In some tools, the measures are insufficiently described. The user, therefore, has to inform herself/himself extensively, a step which takes time and could lead to a loss of interest and information. Therefore, it would be better if highly specific measures were proposed. Almost every tool makes recommendations by linking together diverse features using filters or scores. Often, for example, the measures are linked to the potential for heat reduction or the building type. Combinations of different filters are more likely to be implemented in filterable catalogues of measures. The AST is the only tool that provides more precise recommendations by scoring a pre-selection of different characteristics of the environment (e.g. slope, soil availability, soil type), urban structure types (development type, fallow land, sports field, extensive green space, grey sealed area etc.) and objectives (e.g. heat reduction, drought reduction, flood safety). More specific results will be given if there is no multiple selection of characteristics for divergent areas, but in fact. only one area is considered in isolation and the information is adjusted to that one site. This could possibly be concretised in the AST or in a novel map-based tool by the user assigning concrete properties to individual sites in an area in a standardised way, enabling the recommendation of targeted measures. Certainly, this would require a considerable volume of input data for large areas; for small project areas, however, the time required would probably be fairly modest, thereby offering the user more concrete decision support. It makes sense to locate or link the advantages and disadvantages, the execution variants and examples briefly and precisely in the tool itself. A very detailed tool for measure recommendations could be created if the user inputs the most precise possible specifications of urban structure types and their characteristics, such as area size, degree of sealing, vegetation or similar.
Furthermore, monetary values could be expanded to support the decision-making process. Here, the tools apply different methods to quantify cost reductions in the health sector or the estimated costs of measures, for example. Since these values, in particular, could sway the decisions of investors, it makes sense to integrate as many such values as possible. However, most tools currently offer only a few such values.
Co-benefits provide further arguments for the implementation of green- and blue infrastructure in planning processes, yet these are hardly reflected in the investigated tools. Therefore, co-benefits could be included in a new tool, alongside socio-economic values, which should be considered more extensively. Our analysis also determined that the tools only address daytime heat stress while ignoring the nocturnal heat load, which is particularly important for physical and mental recovery (
Methodological limitations
Most of the assessed tools were developed in Germany and Europe; this can be attributed to the specific search terms, as well as the geographical location of our search. As previously mentioned, we made use of Google search to locate the investigated tools. This method was chosen as it reflects the likely approach of a typical planning office faced with limited staff and time. However, the use of the Google search engine raises a few uncertainties that should be pointed out. On the one hand, Google weights the search results on the basis of ranking systems and search algorithms (
Regarding the analysis of the selected tools, it should be pointed out that a large number of the assessment criteria were drawn from those identified by
In general, the term “tool” is all encompassing, covering diverse planning tools and instruments that can be either digital or analogue (guidelines, maps, brochures etc.) and many results were excluded. For this study, therefore, we had to give a closer definition of the meaning of “tool” (see Introduction). This reduced our sample to a small group of tools (eight in total, see Fig.
Concept for a new web tool
The tool-comparison and analysis in this study serves as a basis for developing a new web tool which focuses on heat stress. It will evaluate the effectiveness of specific heat adaption measures in open space, as well as for indoor conditions. The results of the literature-based tool-review and assessment were used to frame a first concept of a new web-tool which is being developed as a part of the joint project “HeatResilientCity II” (http://heatresilientcity.de/en/).
The preceding analyses have shown that many tools do not require prior experience, what supports the idea of easy-to-use tools. Still, many tools show a deficit in the overall transferability and were only developed for specific areas. Tools which are not developed for a special area usually give generalised results. Some tools try to overcome the generalisation by implementing local geodata. However, the microclimatic situation is, in most tools, considered in an insufficient manner. The criteria of the preceding tool-assessment (Table 3) were used to define requirements on the new tool under development. The assessment of the tools discussed showed a need for improvement in the following aspects, in particular: (1) assessment of heat stress itself using a human-bioclimatic index and not only air temperature; (2) heat stress assessment at the urban site scale and with a high spatial resolution; (3) consideration of different daytimes as heat stress is variable according to the time of day; (4) consideration of different scenarios of sealing, building, planting and (5) overall transferability of the tool on to different regions. All these criteria are, therefore, addressed during the conception of the new tool.
All these points raised will be regarded in the new tool. Their implementation will be described in the following. The new tool will make use of detailed and highly resolved microclimate simulations for assessing the heat stress to generate accurate results (first requirement). The microclimate simulation data for the indoor and outdoor situations will be already implemented in the tool. Thus, there is no need for the user to search and implement further geodata. Further, the tool will be based on a pre-defined selection of different urban site scenarios at a micro-scale whose effects on their microclimate were simulated. That allows the comparison between several scenarios which can either represent initial situations, as well as different heat adaptation measures (second and fourth requirement). Additionally, heat stress will be assessed not only for daytime, but also for night-time and evening (third requirement). Looking at the existing tools, heat stress at night-time is only considered in the GREENPASS tool using the PET. Therefore, it was an important criterion to assess the heat stress for urban residents during different times of the day as this information is not given by most of the present tools. Last, but not least, the tool will be transferable to areas having a climate similar to the climatic conditions used for the simulations (fifth requirement). It will not be limited to a certain research area. Most of the existing tools do not guarantee transferability and are, therefore, very limited regarding their potential use. With a transferable tool, the number of users might grow significantly.
The new tool will provide digital support for the planning and implementation of climate change adaptation measures (with a focus on heat adaptation) at district and site level. In particular, users will be able to visually map and assess the potential impacts of specific heat stress adaptation measures. It is intended to serve as a planning support tool for municipal employees (e.g. within city planning and environmental agencies), as well as an information platform for private users and will also benefit from the trans- and interdisciplinary knowledge generation and methodological innovations gained in the first phase of HRC on urban climate and heat stress, indoor climate and ecosystem services (Westermann et al. 2021a). The utilisation of the HRC tool will bring added value by aiding the selection of appropriate measures to improve the urban climate and indoor comfort, protect and promote urban greenery, as well as foster a more sustainable, social-ecological urban development. To this end, it will generate supporting arguments for decision-making processes on adaptation measures, as well as recommendations for private users on how to behave during periods of excess heat or how to improve the indoor climate.
To ensure that the HRC tool has a user-friendly design and simple interface, it is being developed together with actors from the municipal administration. In the initial development phase, a small survey was conducted online within the administrations of the German partner cities Dresden and Erfurt to identify the requirements and wishes of potential users for such a planning tool. A total of twelve employees from the Departments of the Environment, Building, City Planning and Health participated in the survey. One desired output indicated by the results would be detailed statements on the heat reduction effects of individual measures. Moreover, the users expressed a particular interest in the evaluation of measures related to tree planting, as well as unsealing. Regarding indoor adaptation measures, the users identified exterior sunshades and open windows for nocturnal passive cooling by natural ventilation as adaptation measures that should be analysed. In the near future, a prototype version of the tool will be tested by potential users, whose feedback will be used for further development and optimisation. The adoption of a type-based approach, for example, ecosystem types (as discussed by
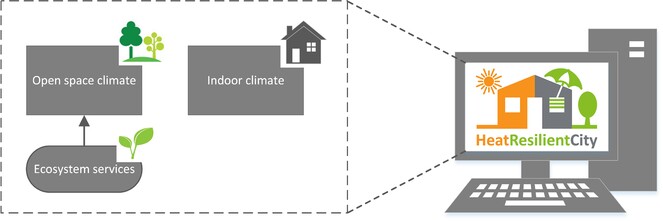
The tool will combine three sub-components: “open space thermal comfort”, “ecosystem services” and “indoor thermal comfort” (see Fig.
Open space thermal comfort
This component will assess the effectiveness of different adaptation measures in reducing urban heat. Their impact will be evaluated with regard to human heat stress, which encompasses short- and longwave radiation, air temperature and humidity, wind speed and direction. Here we make use of the Universal Thermal Climate Index (UTCI,
Ecosystem services
When the tool is ready, this component will probably end up being a subcomponent of the “open space thermal comfort”. It will provide the user with a description and evaluation of further co-benefits provided by certain heat adaptation measures and, thus, create a more comprehensive view of their diverse impact (here: on ecosystem services).
The ES assessment of the pre-defined model areas (which are also used for the open space climate simulation) follows the approach developed by
Indoor thermal comfort
The second main component of the tool assesses the impact of adaptation measures on indoor overheating in residential buildings. In a first step, the user will be able to assess the current indoor thermal state of a room by providing information on the building type, the exposure of windows and location of the room within the building, for example. Based on these data, the risk of overheating is visualised by means of a five-level traffic-light system (from red for very high risk to green for minimum risk). After defining the initial state of the room, the user can choose different heat adaptation measures, such as solar shading devices or green roofs. Application of the selected measure to the initial room conditions may change the intensity of overheating, indicated by a shift in the traffic light, for example, from red to yellow or green. The assessment of the initial risk of overheating and the adapted risk are both based on simulations of building performance and indoor comfort monitoring for different residential buildings conducted in the HeatResilientCity I and II projects, as well as other projects (
Conclusions
To deal with the increased frequency and intensity of extreme heat events in cities (as predicted by many studies, as well as the current IPCC report), adaptation measures are urgently needed at the local scale. This review has identified a range of existing tools for the effective planning and implementation of climate change adaptation measures. Such tools can help save manpower and time – both of which are usually scarce at the municipal level – in the selection of suitable measures. They can also assist areas with scarce data availability to plan appropriate measures. However, such tools are still rarely used in practice. The challenge here is to find ways of creating useful tools for everyday planning that are not overly generalised and which do not require user expertise. Tools have the potential to simplify the work process and also give some first rough estimates about needed measures, knowledge that can be particularly valuable in the conceptual planning phase. The outputs of tools, such as identifying suitable adaptation measures and their impact, as well as other co-benefits (e.g. improved ecosystem services), can support the decision-making process and promote climate-adapted, sustainable urban development. In the future, tools should increasingly make use of local (geo-)data; here, the application of "big data" could also play a major role in the years to come. Furthermore, decision-making processes can be greatly aided by estimates of the likely costs (and savings) if measures are implemented. We recommend that future tools should focus on small spatial scales, such as individual sites. In general, it is also advisable that practitioners help design tools to ensure their practicality in everyday planning activities. Here, the participation of user groups in the development process can ensure a well adapted and application-oriented solution.
The previous assessment of existing tools helped to point out several disadvantages in existing tools and serves as a basis for framing overall requirements on a new tool for assessing heat adaptation measures. With the development of the presented web-tool, needed improvements for tools addressing heat stress for middle-European conditions, as pointed out earlier, are achieved. For deviating climatic conditions, new data would have to be compiled. The special features of the tool compared with previous development are the assessment of heat stress using a human-bioclimatic index at the urban site scale and with a high spatial resolution, the consideration of different daytimes, consideration of different scenarios of sealing, building, planting and the overall transferability of the tool.The new tool partly fits in the gap between detailed climate simulations and only qualitative evaluation of adaption measures. Still, there is a large trade-off to make between overall transferability and output-accuracy of such a tool. It cannot replace detailed and accurate urban climate simulations for specific planning issues and is, rather, suitable to provide the user in practice with a first overview of the quantitative and qualitative effectiveness of adaptation measures to heat. A very detailed and area-specific heat stress assessment can only be carried out by individual microclimate simulations which consider local circumstances. However, this would not fit the overall concept of an open-access tool which tries to reach users with less scientific background and providing a first guess for the effect of adaptation measures. Considering that, the new tool will serve as an important support for decision-makers or administration offices to evaluate and implement heat adaptation in their planning, as well as local residents who just want to inform themselves. Not least, this tool (as well as other tools) helps to raise awareness of urban heat stress and climate adaptation and its role in future city planning.
Acknowledgements
This research was primarily funded by the Federal Ministry of Education and Research (BMBF) in the joint project “HeatResilientCity” (subproject grant number: 01LR1724A and D, 01LR2011A and F). The project manager is the DLR project management agency (DLR-PT). We thank employees of the Departments of the Environment, Building, City Planning and Health of the cities of Dresden and Erfurt for their participation in the survey. Finally, the authors would like to thank Derek Henderson for language polishing and the anonymous reviewers for their support and constructive comments.
Author contributions
P.B. wrote the preliminary draft with the support of T.F., U.M., A.Z., C.S. and J.W. The review and analysis of tools was conducted by L.M.. A.Z., K.G. and P.B. supervised and gave valuable input to the analysis. All authors were involved in reviewing/editing the manuscript and approved the final version.
Conflicts of interest
The authors declare no conflict of interest.
References
- Climate change adaptation planning in large cities: A systematic global assessment.Environmental Science & Policy66:375‑382. https://doi.org/10.1016/j.envsci.2016.06.009
- Stadtklima im Klimawandel. In:Warnsignal Klima: Gesundheitsrisiken; Gefahren für Pflanzen, Tiere und Menschen.GEO Wissenschaftliche Auswertungen,Hamburg.
- Stadt im Klimawandel. Klimaanpassung in der Stadtplanung. Grundlagen, Maßnahmen und Instrumente.Universität Stuttgarthttps://doi.org/10.18419/opus-9821
- Principles of the New Universal Thermal Climate Index (UTCI) and its Application to Bioclimatic Research in European Scale.Miscellanea Geographica14(1):91‑102. https://doi.org/10.2478/mgrsd-2010-0009
- Urbanes Grün in der doppelten Innenentwicklung. Abschlussbericht zum F+E-Vorhaben „Entwicklung von naturschutzfachlichen Zielen und Orientierungswerten für die planerische Umsetzung der doppelten Innenentwicklung sowie als Grundlage für ein entsprechendes Flächenmanagement” (FKZ 3513 82 0500).BfN-Skripten 444.Bundesamt für Naturschutz,Bonn-Bad Godesberg.
- Urban greening to cool towns and cities: A systematic review of the empirical evidence.Landscape and Urban Planning97(3):147‑155. https://doi.org/10.1016/j.landurbplan.2010.05.006
- Deriving the operational procedure for the Universal Thermal Climate Index (UTCI).International Journal of Biometeorology56(3):481‑494. https://doi.org/10.1007/s00484-011-0454-1
- Simulating surface–plant–air interactions inside urban environments with a three dimensional numerical model.Environmental Modelling & Software13:373‑384. https://doi.org/10.1016/s1364-8152(98)00042-5
- Die Auswirkungen kleinskaliger Umweltgestaltung auf das Mikroklima. Entwicklung des prognostischen numerischen Models ENVI-Met zur Simulation der Wind-, Temperatur- und Feuchterverteilung in städtischen Strukturen.Universität Bochum,Bochum.
- From City- to Site-Dimension: Assessing the Urban Ecosystem Services of Different Types of Green Infrastructure.Land9(5). https://doi.org/10.3390/land9050150
- A multi-criteria analytical method to assess ecosystem services at urban site level, exemplified by two German city districts.Ecosystem Services49https://doi.org/10.1016/j.ecoser.2021.101268
- INKAS - ein vielseitiges Klimabe-ratungswerkzeug für die Stadtentwicklung. In:Warnsignal Klima: Die Städte.
- Heat Resilient Cities. Measuring benefits of urban heat adaptation. Methodology note for the tool development.C40 and RambollURL: https://ramboll.com/-/media/files/rm/c40---heat-resilience/c40-heat-adaption-tool.pdf?la=en
-
Glasgow Climate Pact 2021. Decision -/CP.26. Advance unedited version.URL: https://unfccc.int/sites/default/files/resource/cop26_auv_2f_cover_decision.pdf
- Temperature and human thermal comfort effects of street trees across three contrasting street canyon environments.Theoretical and Applied Climatology124:55‑68. https://doi.org/10.1007/s00704-015-1409-y
- Adding map layers. URL: https://publicwiki.deltares.nl/display/AST/Adding+map+layers
- Urban Heat Stress. URL: https://publicwiki.deltares.nl/display/AST/Urban+heat+stress
- Urban Water balance model. URL: https://publicwiki.deltares.nl/display/AST/Urban+Water+balance+model
- Green benefits. URL: https://publicwiki.deltares.nl/display/AST/Green+benefits
- Adaptation Support Tool for Climate Resilient Cities. URL: https://www.deltares.nl/en/software/adaptation-support-tool-ast/
- Supporting climate proof planning with CLARITY's climate service and modelling of climate adaptation strategies – the Linz use-case.Urban Climate34https://doi.org/10.1016/j.uclim.2020.100675
-
Microclimate and Urban Heat Island Mitigation Decision-Support Tool (Project Short Report).
- INKAS Nutzeranleitung.Deutscher WetterdienstURL: https://www.dwd.de/DE/leistungen/inkas/pdf/inkas_nutzeranleitung_barrierefrei.pdf?__blob=publicationFile&v=2
- The impact of proxy-based methods on mapping the distribution of ecosystem services.Journal of Applied Ecology47(2):377‑385. https://doi.org/10.1111/j.1365-2664.2010.01777.x
- Public attitudes to, and behaviours taken during, hot weather by vulnerable groups: results from a national survey in England.BMC Public Health21(1). https://doi.org/10.1186/s12889-021-11668-x
- Auswirkungen der Hitzewelle auf das eigene Wohlbefinden. Auftraggeber: DAK Gesundheit. https://www.rosenheim24.de/bilder/2010/07/14/840682/224332385-dak-hitze-studie.pdf. Accessed on: 2020-12-10.
- Mitigation versus adaptation: Does insulating dwellings increase overheating risk?Building and Environment143:740‑759. https://doi.org/10.1016/j.buildenv.2018.07.033
- Adapting to climate change through urban green infrastructure.Nature Climate Change2(10):704‑704. https://doi.org/10.1038/nclimate1685
- How search algorithms work. https://www.google.com/intl/us/search/howsearchworks/algorithms/. Accessed on: 2021-12-30.
- Greenpass Imagefolder. https://greenpass.io/gp-imagefolder-de/. Accessed on: 2020-12-01.
- Greenpass Development. https://greenpass.io/de/development/. Accessed on: 2020-12-01.
- Greenpass Software. https://greenpass.io/de/software/. Accessed on: 2020-12-01.
- Klimaresilienz. http://www.gruenplan.at/objektplanung/klimaresilienz.html. Accessed on: 2020-12-01.
- Clarity4ClimateResilience Advanced Urban Screening.https://youtu.be/FGKBFGqeVPw. Accessed on: 2020-12-20.
- CLARITY für Klimaresilienz - "In meiner Region: Linz, Österreich".Zenodohttps://doi.org/10.5281/zenodo.4049986
- Stadtklima.Verlag Ferdinand Schöninghhttps://doi.org/10.36198/9783838548494
- The physiological equivalent temperature - a universal index for the biometeorological assessment of the thermal environment.International Journal of Biometeorology43(2):71‑75. https://doi.org/10.1007/s004840050118
- Climate Change 2014: Synthesis Report. Contribution of Working Groups I, II and III to the Fifth Assessment Report of the Intergovernmental Panel on Climate Change.IPCC,Geneva, Switzerland,155pp.
- Summary for Policymakers. In: Climate Change 2021: The Physical Science Basis. Contribution of Working Group I to the Sixth Assessment Report of the Intergovernmental Panel on Climate Change.Cambridge University Press
- Folgen des Klimawandels für die Gesundheit.In:Der Klimawandel - Einblicke, Rückblicke und Ausblicke.Potsdam.
- UTCI—Why another thermal index?International Journal of Biometeorology56(3):421‑428. https://doi.org/10.1007/s00484-011-0513-7
- Population health effects and health-related costs of extreme temperatures: Comprehensive evidence from Germany.Journal of Environmental Economics and Management91:93‑117. https://doi.org/10.1016/j.jeem.2018.06.004
- Developing green infrastructure design guidelines for urban climate adaptation.Journal of Landscape Architecture12(3):60‑71. https://doi.org/10.1080/18626033.2017.1425320
- Heat Stress and Public Health: A Critical Review.Annual Review of Public Health29(1):41‑55. https://doi.org/10.1146/annurev.publhealth.29.020907.090843
- Climate-resilient urban planning and architecture with GREENPASS illustrated by the case study ‘FLAIR in the City’ in Vienna.IOP Conference Series: Earth and Environmental Science323(1). https://doi.org/10.1088/1755-1315/323/1/012087
- Evaluation of overheating protection with sun-shading systems.Solar Energy69:59‑74. https://doi.org/10.1016/s0038-092x(01)00017-2
- Improving heat resilience of prefab concrete residential buildings – vulnerability, adaptation measures and structural implementation.26th Annual Conference of the International Sustainable Development Research Society (ISDRS),Budapest, Hungary,15- 17 July 2020.pp. 706–716pp.
- Hitzeangepasste Quartiersplanung: Parameter.https://www.lanuv.nrw.de/klima/klimaanpassung-in-nrw/fis-klimaanpassung-nordrhein-westfalen/hitzeangepasste-quartiersplanung/parameter. Accessed on: 2020-12-08.
-
Adaptation Compass – Futures Cities urban networks to face climate change. Guidance for developing climate-proof city regions.URL: http://www.future-cities.eu/fileadmin/user_upload/pdf/FUTURE-CITIES_Adaptation-Compass_Guidance.pdf
- Wie kommt der Klimawandel bei Kommunen an? Ergebnisse einer Umfrage.LUBWURL: https://pudi.lubw.de/detailseite/-/publication/10025
- Mapping and Assessment of Ecosystems and their Services. Indicators for ecosystem assessment under Action 5 of the EU Biodiversity Strategy to 2020.2nd Report.European Commission, Directorate-General for Environment - Publications Officehttps://doi.org/10.2779/2286
- Urban Green Spaces: Potentials and Constraints for Urban Adaptation to Climate Change.Resilient Cities479‑485. https://doi.org/10.1007/978-94-007-0785-6_47
- Reconceptualizing green infrastructure for climate change adaptation: Barriers to adoption and drivers for uptake by spatial planners.Landscape and Urban Planning138:155‑163. https://doi.org/10.1016/j.landurbplan.2015.02.010
- Counteracting urban climate change: adaptation measures and their effect on thermal comfort.Theoretical and Applied Climatology115:243‑257. https://doi.org/10.1007/s00704-013-0890-4
- Press release 17.06.2020: Hilfe für Kommunen: Neuen Online-Tool hilft Stadtplanern bei der Anpassung an die Folgen des Klimawandels.https://www.umwelt.nrw.de/presse/detail/hilfen-fuer-kommunen-neues-online-tool-hilft-stadtplanern-bei-der-anpassung-an-die-folgen-des-klimawandels-1592382510. Accessed on: 2020-12-23.
- Urban Heat Island Strategy. City of Vienna.Vienna Environmental Protection Department – Municipal Department
- City size and the urban heat island.Atmospheric Environment (1967)7(8):769‑779. https://doi.org/10.1016/0004-6981(73)90140-6
- Building heat-resilient neighborhoods - testing the implementation on buildings and in open spaces in two sample quarters Dresden and Erfurt. In:Building resilience to natural hazards in the context of climate change – knowledge integration, implementation, and learning.Springerhttps://doi.org/10.1007/978-3-658-33702-5
- Ranking local climate policy: assessing the mitigation and adaptation activities of 104 German cities.Climatic Change167https://doi.org/10.1007/s10584-021-03142-9
- The influence of small green space type and structure at the street level on urban heat island mitigation.Urban Forestry & Urban Greening21:203‑212. https://doi.org/10.1016/j.ufug.2016.12.005
- Green Resilient City - A framework to integrate the Green and Open Space Factor and climate simulations into everyday planning to support a green and climate-sensitive landscape and urban development.IOP Conference Series: Earth and Environmental Science323(1). https://doi.org/10.1088/1755-1315/323/1/012082
- Window Ventilation Behavior for Overheating Evaluation: Residents’ Survey and Derived Ventilation Profiles.International Journal of Built Environment and Sustainability8(3):121‑133. https://doi.org/10.11113/ijbes.v8.n3.852
- Proceedings of IABSE Symposium Wroclaw 2020.
- Mitigation and adaptation in multifamily housing: overheating and climate justice.Buildings and Cities1(1):36‑55. https://doi.org/10.5334/bc.12
- Guidelines to Calibrate a Multi-Residential Building Simulation Model Addressing Overheating Evaluation and Residents’ Influence.Buildings11(6). https://doi.org/10.3390/buildings11060242
- How window ventilation behaviour affects the heat resilience in multi-residential buildings.Building and Environment202https://doi.org/10.1016/j.buildenv.2021.107987
- Microclimate modelling of street tree species effects within the varied urban morphology in the Mediterranean city of Tel Aviv, Israel.International Journal of Climatology30(1):44‑57. https://doi.org/10.1002/joc.1869
- Zum Einfluss von Bäumen und Oberflächenbelag auf das Mikroklima innerstädtischer Freiflächen. Das Beispiel der Stadt Bozen (Südtirol, Italien).Naturschutz und Landschaftsplanung52(08):378‑384.
- The thermal regime of urban parks in two cities with different summer climates.International Journal of Remote Sensing19(11):2085‑2104. https://doi.org/10.1080/014311698214884
- Search Engine Market Share Worldwide. Jan 2019 - Oct 2021.https://gs.statcounter.com/search-engine-market-share#monthly-201901-202110. Accessed on: 2021-10-30.
- Gesundheitliche Anpassung an den Klimawandel. Ratgeber. https://www.umweltbundesamt.de/sites/default/files/medien/publikation/long/3753.pdf. Accessed on: 2020-11-10.
- Themenblatt: Anpassung an den Klimawandel. Hitze in der Stadt. Eine Kommunale Gemeinschaftsaufgabe.UBAURL: https://www.umweltbundesamt.de/sites/default/files/medien/364/publikationen/kompass_themenblatt_hitze_stadt_2015_net.pdf
- Einfluss des Klimawandels auf die Biotropie des Wetters und Gesundheit bzw. die Leistungsfähigkeit der Bevölkerung in Deutschland.UBAURL: https://www.umweltbundesamt.de/sites/default/files/medien/378/publikationen/ug_06_2015_einfluss_des_klimawandels_auf_die_biotropie_des_wetters_0.pdf
- Bewertung klimawandelgebundener Risiken: Schadenspotentiale und ökonomische Wirkung von Klimawandel und Anpassungsmaßnahmen. Abschlussbericht zum Vorhaben „Behördenkooperation Klimawandel und -anpassung”, Teil 1.UBAURL: https://www.umweltbundesamt.de/sites/default/files/medien/479/publikationen/cc_29-2020_bewertung_klimawandelgebundener_risiken_teilbericht_1.pdf
- Klimaanpassung jetzt gesetzlich verankern. https://www.umweltbundesamt.de/sites/default/files/medien/2546/dokumente/uba_vorschlaege_zur_klimaanpassung.pdf. Accessed on: 2021-10-30.
- The influence of green areas on nocturnal temperatures in a high latitude city (Göteborg, Sweden).International Journal of Climatology18(6):681‑700. https://doi.org/10.1002/(sici)1097-0088(199805)18:63.0.co;2-l
- Press release 05.10.2020: Hilfe für Städte im Kampf gegen den Klimawandel.https://urban-digital.de/hilfe-staedte-im-kampf-gegen-klimawandel. Accessed on: 2020-12-04.
- Adaptation Planning Support Toolbox: Measurable performance information based tools for co-creation of resilient, ecosystem-based urban plans with urban designers, decision-makers and stakeholders.Environmental Science & Policy66:427‑436. https://doi.org/10.1016/j.envsci.2016.06.010
- Urban green infrastructure: A review on valuation toolkits from an urban planning perspective.Journal of Environmental Management267https://doi.org/10.1016/j.jenvman.2020.110603
- Umweltmeteorologie. Methoden zur humanbiometeorologischen Bewertung von Klima und Lufthygiene für die Stadt- und Regionalplanung Teil 1: Klima.VDI-Richtlinie 37872.
- The impact of blue space on human health and well-being – Salutogenetic health effects of inland surface waters: A review.International Journal of Hygiene and Environmental Health214(6):449‑460. https://doi.org/10.1016/j.ijheh.2011.05.001
- Analysebericht. Analyse von Stärken und Hemmnissen sowie Einflussfaktoren für die Umsetzbarkeit, Wirksamkeit und Akzeptanz von lokalen Klimaanpassungsmaßnahmen in Dresden und Erfurt. Unter Mitarbeit von Annika Poblocki.IOER,141pp.
- Hitzeanpassung von Stadtquartieren: Akteursperspektiven und Umsetzungsansätze.GAIA - Ecological Perspectives for Science and Society30(4):257‑267. https://doi.org/10.14512/gaia.30.4.9
- Thermische Exposition von Fußgängern im Dresdner Stadtviertel Gorbitz im Sommer 2018: Auswertung von Fußgänger-Messungen und Modellsimulationen.IÖR Schriften77.
Supplementary materials
The results of the internet search, including the exclusion criteria in the last eight columns. The tools highlighted in grey are those which were subject to an in-depth analysis.
Table of data inputs/outputs. This serves as a quick qualitative overview of the scope and complexity of the tools and a basis for the planning tool performance table (Fig. 3). The sources for this table are listed in Fig. 2.