|
One Ecosystem :
Research Article
|
|
Corresponding author: Boika Malcheva (boika.malcheva@gmail.com), Miglena Zhiyanski (miglena.zhiyanski@gmail.com)
Academic editor: Carla-Leanne Washbourne
Received: 06 Mar 2020 | Accepted: 01 Jun 2020 | Published: 12 Jun 2020
© 2020 Boika Malcheva, Maya Nustorova, Miglena Zhiyanski, Maria Sokolovska, Rositsa Yaneva, Evgeny Abakumov
This is an open access article distributed under the terms of the Creative Commons Attribution License (CC BY 4.0), which permits unrestricted use, distribution, and reproduction in any medium, provided the original author and source are credited.
Citation:
Malcheva B, Nustorova M, Zhiyanski M, Sokolovska M, Yaneva R, Abakumov E (2020) Diversity and activity of microorganisms in Antarctic polar soils. One Ecosystem 5: e51816. https://doi.org/10.3897/oneeco.5.e51816
|
|
Abstract
The study is focused on microbiological analyses in polar soils in selected monitoring sites in Livingstone Island, Antarctica region. The analyses include determination of the quantity and qualitative composition of the heterotrophic block of soil microflora (non-spore-forming bacteria, bacilli, actinomycetes, micromycetes, bacteria absorbing mineral nitrogen), insofar as it plays a major role in the element cycling and soil formation processes. Aerobic (rapidly and slowly growing) and anaerobic groups of soil microorganisms were investigated and the biogenicity (total microflora) and the rate of mineralisation processes (mineralisation coefficient) were determined. Mostly non-spore-forming aerobic bacteria, followed by actinomycetes, are dominant in determining the biogenicity of the studied polar soils. The rearrangement of the microorganisms in the composition of the total microflora by degree of dominance indicates the participation of all the studied groups of microorganisms in most sites in the initial and final stages of the decomposition of organic matter. The mineralisation of soils is most active in sites with vegetation cover. The established pigmentation in aerobic microorganisms is probably due to their good adaptation and protection under extreme polar conditions, while the absence of oxygen impedes the formation of pigments.
Keywords
polar soils, non-spore-forming bacteria, bacilli, actinomycetes, micromycetes, bacteria absorbing mineral nitrogen
Introduction
The soil microflora in Antarctica have been intensively studied by a number of scientists in recent decades. A general trend of the studies is the heterogeneity of microbial communities from different parts of the continent. Dominant bacterial genera were isolated and less common, including extremophiles, bacterial biomass and structure of their communities were analysed (
An evolution in understanding the microbial diversity of soil habitats in Antarctica has been observed during the last two decades. Early studies have shown the presence of microbial endemism at species level (and to a lesser degree of the genus level), but soil isolates from the continental sites have been relatively restricted to a narrow range of families dominated, in particular, by Gram-positive bacteria Firmicutes (
The number of microbiological studies of the “Ice continent” is still relatively small and too early to fully understand the microbial diversity model in extreme conditions. It is a fact that conflicting results have been reported - for example, in Antarctica,
In the area of Livingston Island, microbiological studies performed by Bulgarian researchers date from 1996. The microflora of penguin excrement has been investigated (
When examining the microbial soil communities on Livingston Island in Antarctica,
The purpose of this study was to determine microbial indicators by analysing the biogenicity of polar soils, establishing the activity of aerobic and anaerobic, "slow growing" and "fast growing" microorganisms, as well as the part of pigmented microbes as an expression of good adaptation and protection of the species under the extreme environmental conditions.
Materials and methods
Polar soils (Gelisols) from different sites located in the region of Livingstone Island were sampled in December 2018. A total number of thirty three (33) samples were collected from sites differentiated according the vegetation cover: without vegetation, under mosses, lichens and grass vegetation. The superficial soil layers were sampled – 0-7 (10 cm) and 7 (10) - 15 cm, depending on the depth of soil profile. Soil samples were air– dried in the laboratory room of the Bulgarian Antarctic Basis on Livingstone Island and transported in plastic bags in January 2019. The description of sites with an indication of the sampling design are presented in Table
|
No. |
Site |
Soil sample |
|
1 |
HPP B1 |
Without vegetation, soil 0-7 cm |
|
2 |
HPP B2-1 |
Mosses, soil 0-7 cm |
|
3 |
HPP B2-2 |
Mosses, soil 7-15 cm |
|
4 |
СА 3 |
Without vegetation, soil 0-7 cm |
|
5 |
CA 2 |
Organogenic soil under nest 0-7 (10 cm) |
|
6 |
CA 1 |
Grass vegetation, soil 0-7 cm |
|
7 |
CA 4-1 |
Without vegetation, soil 0-7 cm |
|
8 |
CA 4-2 |
Without vegetation, soil 7-15 cm |
|
9 |
JD 1-1 |
Mosses, soil 0-7 cm |
|
10 |
JD 1-2 |
Grass vegetation, soil 0-7 cm |
|
11 |
BP 1 |
Mosses, soil 0-7(10) cm) |
|
12 |
SV 1-1 |
Without vegetation, soil 0-7 cm |
|
13 |
SV 1-2 |
Mosses, soil 0-7 cm |
|
14 |
SV 2 |
Mosses + grass vegetation, soil 0-7 cm |
|
15 |
SV 3 |
Mosses, soil 0-7 cm |
|
16 |
РВ 1 |
Without vegetation, soil 0-7 (10 cm) |
|
17 |
РВ 2-1 |
Mosses, soil 0-7 cm |
|
18 |
РВ 2-2 |
Grass vegetation, soil 0-7 cm |
|
19 |
РВ 3-1 |
Mosses, soil 0-7 cm |
|
20 |
PB 3-2 |
Mosses, soil 7-15 cm |
|
21 |
РВ 3´-1 |
Mosses + grass vegetation 0-10 cm |
|
22 |
РВ 3´-2 |
Mosses + grass vegetation 10-15 cm |
|
23 |
НРР 1 Skua-1 |
Mosses, soil 0-7 (10) cm |
|
24 |
НРР 1 Skua-2 |
Lichens, soil 0-7 cm |
|
25 |
HAN 1 - 1 |
Mosses, soil 0-7 cm |
|
26 |
HAN 1 - 2 |
Mosses (turf), soil 0-7 cm |
|
27 |
HAN 2 |
Grass vegetation, soil 0-7 cm |
|
28 |
PUN-H1 |
Mosses, soil 0-7 cm |
|
29 |
PUN-H2-1 |
Mosses, soil 0-7 cm |
|
30 |
PUN-H2-2 |
Mosses, soil 7-15 cm |
|
31 |
PUN-H2-3 |
Lichens, soil 0-7 cm |
|
32 |
НРР 2 Skua -1 |
Mosses, soil 0-7 cm |
|
33 |
НРР 2 Skua -2 |
Lichens (black), soil 0-7 cm |
Microbiological analyses were realised in March-July 2019 and include determining the amount and composition of the heterotrophic block of soil microflora, insofar as it plays a major role in the processes of soil formation and the elemental cycles in ecosystems. The amount of aerobic microbial communities (total microflora) and the quantitative presence and composition of anaerobes in microbocenosis were investigated. In addition, representative enzymatic activities of soil microbial inhabitants have been determined as an expression of their biochemical activity and role in the transformation of organic compounds. The content of organic carbon in microbial biomass was also investigated as an expression of the relative participation and role of microorganisms in the composition of soil organic matter.
The methods of analysis followed
Heterotrophic block of microbocenosis - by methods of dilution and three times inoculation of solid nutrient medium with subsequent reading of colony-forming units (CFU) in 1 g abs. dry soil:
Aerobic component of microflora - systematic and physiological groups of germs - bacilli and non-spore-forming bacteria (ordinary agar), micromycetes (mould fungi) - of Chapek-Dox agar, actinomycetes and bacteria that absorb mineral nitrogen (Actinomycete isolation agar) have been identified.
Anaerobic component of microflora - the cultures were cultivated on the same nutrient medium in anaerobic pods.
Statistical processing of the data from the microbiological indicators include calculating the average value of three repetitions and coefficient of variation by the use of Excel 2010.
Results and discussion
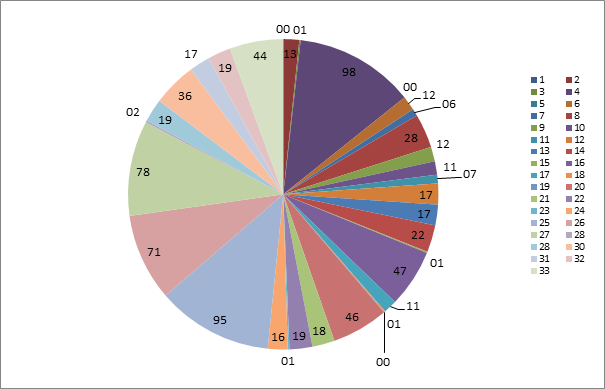
The biogenicity (quantitative presence of microorganisms) of the studied polar soils as expected was low (up to about 10,000 times lower in the upper layer compared to forest and cultivated soils) and of varying intensity at individual sites, depending on the presence of vegetation and sampling depth. The aerobic heterotrophic block of soil microflora is presented in Table
Quantity and qualitative composition of aerobic soil microorganisms (CFU x 10/g abs. dry soil); ±CV.
* CV up to 10% for all variants and each group of microorganisms (low dispersion)
|
No. |
Total microflora (aerobes) |
Non-spore-forming bacteria |
Bacillus |
Actino- mycetes |
Micro- mycetes |
Bacteria absorbing mineral nitrogen |
Mineralisation coefficient |
|
1 |
7060 |
6980±2.57 |
80±0.00 |
0 |
0 |
4700±2.43 |
0.67 |
|
2 |
3920 |
2880±4.54 |
20±0.00 |
760±6.45 |
260±3.54 |
3620±4.06 |
1.25 |
|
3 |
10220 |
9980±1.64 |
220±7.42 |
0 |
20±0.00 |
4100±3.98 |
0.40 |
|
4 |
3440 |
1960±4.17 |
700±2.33 |
500±6.53 |
280±3.29 |
1460±2.24 |
0.55 |
|
5 |
9780 |
9720±1.68 |
60±0.00 |
0 |
0 |
6040±2.16 |
0.62 |
|
6 |
10140 |
8900±1.83 |
200±8.16 |
640±2.55 |
400±2.32 |
6360±2.05 |
0.70 |
|
7 |
11820 |
10000±1.31 |
160±6.15 |
1600±3.06 |
60±0.00 |
4000±3.67 |
0.39 |
|
8 |
8160 |
4400±2.23 |
660±2.47 |
700±4.67 |
2400±4.76 |
3640±3.59 |
0.72 |
|
9 |
11380 |
4180±2.34 |
280±5.83 |
3520±1.86 |
3400±2.88 |
2240±7.29 |
0.50 |
|
10 |
2200 |
1920±3.40 |
180±9.07 |
100±8.84 |
0 |
2020±7.28 |
0.96 |
|
11 |
5460 |
3180±3.59 |
500±3.27 |
1600±2.04 |
180±5.05 |
2220±5.15 |
0.60 |
|
12 |
7180 |
3160±3.62 |
500±6.53 |
1640±1.99 |
1880±5.21 |
2160±5.29 |
0.59 |
|
13 |
3440 |
3080±3.71 |
280±3.45 |
20±0.00 |
60±0.00 |
4780±2.05 |
1.42 |
|
14 |
2480 |
2000±4.90 |
320±5.10 |
140±6.43 |
20±0.00 |
2580±3.80 |
1.11 |
|
15 |
4940 |
2800±2.33 |
1600±4.08 |
300±5.44 |
240±3.82 |
4960±2.30 |
1.13 |
|
16 |
6860 |
2100±3.89 |
360±4.54 |
2520±2.59 |
1880±3.47 |
1980±4.95 |
0.80 |
|
17 |
10380 |
2560±3.83 |
7820±1.88 |
0 |
0 |
4560±2.15 |
0.44 |
|
18 |
5700 |
4780±2.39 |
400±4.08 |
120±7.44 |
400±2.40 |
4800±2.72 |
0.93 |
|
19 |
6780 |
6120±1.07 |
140±6.43 |
520±6.28 |
0 |
2600±3.77 |
0.42 |
|
20 |
7320 |
2860±3.43 |
520±3.14 |
3040±3.22 |
900±5.44 |
2420±4.05 |
0.72 |
|
21 |
5680 |
2620±3.12 |
900±3.63 |
1400±4.67 |
760±4.30 |
2000±3.27 |
0.57 |
|
22 |
3900 |
2760±3.55 |
100±8.84 |
820±3.98 |
220±4.16 |
5320±1.23 |
1.86 |
|
23 |
8380 |
3820±2.14 |
260±6.28 |
3200±4.08 |
1100±4.45 |
4780±1.37 |
1.17 |
|
24 |
8700 |
1960±5.00 |
480±3.40 |
4020±3.66 |
2240±5.10 |
4080±1.60 |
1.67 |
|
25 |
7380 |
400±4.08 |
380±4.30 |
3200±3.57 |
3400±3.36 |
600±2.72 |
0.77 |
|
26 |
8520 |
160±5.66 |
180±5.05 |
4180±3.13 |
4000±3.27 |
320±5.10 |
0.94 |
|
27 |
3020 |
1540±2.12 |
520±1.79 |
520±1.79 |
440±3.71 |
1520±1.07 |
0.74 |
|
28 |
3760 |
3240±2.02 |
180±5.44 |
300±3.07 |
40±0.00 |
3600±1.81 |
1.05 |
|
29 |
9100 |
4400±2.60 |
400±2.40 |
4160±3.53 |
140±6.43 |
2000±4,08 |
0.42 |
|
30 |
6180 |
3400±2.40 |
480±1.94 |
1300±2.51 |
1000±4.90 |
2140±2,29 |
0.55 |
|
31 |
8160 |
6720±0.97 |
20±0.00 |
660±4.95 |
760±6.45 |
4360±1,87 |
0.65 |
|
32 |
12320 |
5560±1.76 |
200±4.88 |
2400±5.44 |
4160±3.53 |
5940±1,10 |
1.03 |
|
33 |
11500 |
3900±2.09 |
880±3.71 |
3280±2.99 |
3440±3.80 |
1940±1,68 |
0.41 |
The total microflora, respectively the most active microbiological processes, have the highest values at 4 sites - soils under moss (HPP 2 Skua, JD 1, PB 2, HPP B2 Bay), followed by the soils under: no vegetation (CA 4), lichen (HPP 2 Skua), grass (CA 1) and in organogenic soil under nest (CA 2). Depending on the location of the sites, the physicochemical and chemical characteristics of the tested samples, different biogenicity was found for soils under the same vegetation cover. When comparing individual sites with the same vegetation cover, the microbial population is found to be lower by 4.6 times in soil under grass (CA 1> JD 1), 3.6 times in soil under mosses (HPP 2 Skua > SV 1), 2.3 times in soil under moss + grass (PB 3´> SV 2), 2.1 times in soil under no vegetation cover (SV 1> CA 3), 1.4 times in soil under lichen compared to soil under black lichen (HPP 2 Skua > PUN-H2). In depth, the total amount of microorganisms decreases 1.5 times in soil under moss + grass (PB 3 ') and increases 1.1 times in soil under mosses (PB 3). This tendency for the same site shows the importance of both vegetation, chemical and physico-chemical soil properties for the development of microorganisms in depth. A similar effect on the reduction of biogenicity was observed in the other two sites - PUN-H2 (1.5 times less germs in moss - top layer than moss - bottom layer) and CA 4 (1.4 times in no vegetation soil - top layer compared to the bottom layer).
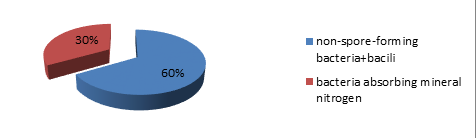
The highest percentage (34 ÷ 99.4%) in the total microflora is formed by non-spore-forming bacteria, except for: PB 2 – soil under mosses (bacilli), PB 1 - soil (actinomycetes dominate), HPP 1 Skua - soil under lichen (actinomycetes and micromycetes dominate), PB 3 – soil under mosses > 7 cm (actinomycetes dominate) and HAN 1 (actinomycetic microflora dominate). The amount of non-spore-forming bacteria in these sites was lower both in comparison with some of the other groups of microorganisms and in general compared to the other sites tested. This tendency to regroup microorganisms in the composition of the general microflora at these sites shows the participation of all groups of microorganisms in the initial and final stages of decomposition of organic matter substances. On the other hand, development of actinomycetes is not observed in some of the sites (HPP B2 Bay - moss, CA 2 - nest, PB 2 - moss, HPP B1 Bay - soil without vegetation) and micromycetes (JD 1 - grass, CA 2 - nest, PB 2 - moss, PB 3 - moss 0-7 cm, HPP B1 Bay - soil without vegetation). Lower development of these two groups of microorganisms has been established in previous studies (
The highest amount of bacteria utilising mineral nitrogen was found in CA 1 (grass), CA 2 (nest) and HPP 2 Skua (moss) and decreased 19.9 times in the site with the lowest development of this group of microorganisms - HAN 1 (moss). The varying development of both the bacteria-absorbing mineral nitrogen and the non-spore-forming bacteria and bacilli, regardless of the vegetation, determine the different values of the mineralisation coefficient (MC). The lowest degradation rate was found in CA 4 (no vegetation – top layer), HPP B2 Bay (moss), HPP 2 Skua (black lichen), PUN-H2 (moss- top layer), PB 2 (moss) and JD 1 (moss) - MC values up to 0.50. Higher values of MC (1.00 ÷ 1.50) for the sites: SV 1 (moss), HPP B2 Bay (soil without vegetation), HPP 1 Skua (moss), SV 3 (moss), SV 2 (moss + grass), PUN-H1 (moss), HPP 2 Skua (moss) and at the highest rate of mineralisation (MK 1.50 ÷ 2.00) the samples at PB 3 '(moss + grass > 10 cm)) and HPP 1 Skua (lichen). The remaining sites (at most) have an average rate of mineralisation of organic matter - MC values from 0.51 to 1.00.
Amongst actinomycetes and micromycetes, species with white, brown and grey-green air micelles occur. The presence of pigment-forming species is also found in mineral nitrogen-absorbing bacteria to a greater extent than in ammonia-producing bacteria. The pigments are of the carotenoid type. Chromogenesis was determined in all studied sites except for HPP B1 Bay - soil and CA2-soil under nest. Probably pigmentation is an expression of good adaptation and protection of the species from the extreme environmental conditions.
The different growth rate of the microorganisms indicates their distribution in each sample, since the determination of the R-strategists shows rapid growth in response to the presence of nutrients, unlike the K-strategists (presented above - Table 2), which are defined as slowly growing (
Anaerobic microorganisms are also present in the composition of microbocenosis, but with a lower amount of aerobes and without pigmentation (Table
Quantity and qualitative composition of anaerobic soil microorganisms (CFU x 10/g abs. dry soil); ±CV.
* CV up to 10% for all variants and each group of microorganisms (low dispersion)
|
No. |
Total microflora (anaerobes) |
Non-spore-forming bacteria |
Bacillus |
Bacteria absorbing mineral nitrogen |
Mineralisation coefficient |
|
1 |
1000 |
820±3.98 |
180±9.07 |
200±8.16 |
0.20 |
|
2 |
920 |
780±2.09 |
140±7.07 |
0 |
0.00 |
|
3 |
3640 |
3480±2.82 |
160±5.66 |
1100±2.97 |
0.30 |
|
4 |
1220 |
1000±3.27 |
220±7.42 |
0 |
0,00 |
|
5 |
4200 |
4000±4.08 |
200±4.56 |
4000±3.67 |
0.95 |
|
6 |
3680 |
3600±3.63 |
80±0.00 |
3900±2.51 |
1.06 |
|
7 |
1580 |
1500±2.18 |
80±0.00 |
1540±1.06 |
0.97 |
|
8 |
1200 |
1120±1.46 |
80±0.00 |
1400±2.33 |
1.17 |
|
9 |
3180 |
2960±2.21 |
220±4.16 |
920±3.55 |
0.29 |
|
10 |
2880 |
2820±2.32 |
60±0.00 |
3060±1.60 |
1.06 |
|
11 |
3100 |
2900±2.82 |
200±8.16 |
1040±1.57 |
0.34 |
|
12 |
1000 |
800±2.04 |
200±4.88 |
100±8.84 |
0.10 |
|
13 |
3220 |
3040±4.30 |
180±5.44 |
1140±2.86 |
0.35 |
|
14 |
0 |
0 |
0 |
0 |
0.00 |
|
15 |
3220 |
3040±2.15 |
180±5.05 |
1180±2.77 |
0.37 |
|
16 |
980 |
800±1.19 |
180±5.44 |
60±0.00 |
0.06 |
|
17 |
3080 |
2880±3.40 |
200±4.56 |
1220±2.68 |
0.40 |
|
18 |
2940 |
2840±1.15 |
100±8.84 |
3100±2.63 |
1.05 |
|
19 |
0 |
0 |
0 |
0 |
0.00 |
|
20 |
3700 |
3480±1.41 |
220±4.42 |
1300±2.51 |
0.35 |
|
21 |
0 |
0 |
0 |
0 |
0,00 |
|
22 |
160 |
100±8.84 |
60±0.00 |
100±8.84 |
0.63 |
|
23 |
3120 |
2940±1.67 |
180±5.44 |
1160±2.82 |
0.37 |
|
24 |
240 |
160±5.66 |
80±0.00 |
60±0.00 |
0.25 |
|
25 |
1080 |
960±3.40 |
120±7.44 |
720±2.27 |
0.67 |
|
26 |
980 |
880±1.86 |
100±8.84 |
700±2.33 |
0.71 |
|
27 |
2880 |
2760±1.77 |
120±8.32 |
2980±1.10 |
1.03 |
|
28 |
2840 |
2700±2.42 |
140±6.43 |
1020±1.60 |
0.36 |
|
29 |
0 |
0 |
0 |
0 |
0.00 |
|
30 |
3260 |
3060±1.60 |
200±8.16 |
920±1.77 |
0.28 |
|
31 |
280 |
200±8.16 |
80±0.00 |
60±0.00 |
0.21 |
|
32 |
3400 |
3240±2.02 |
160±5.66 |
1280±2.55 |
0.38 |
|
33 |
240 |
120±7.44 |
120±7.44 |
620±2.63 |
2.58 |
The total amount of anaerobic microorganisms is highest in CA 2 (under nest), PB 3 (moss > 7 cm), CA 1 (grass) and HPP B2 Bay (moss), falling from 13 to 26 times in PUN-H2. (lichen), HPP 2 Skua (black lichen) and PB 3 '(moss + grass > 10 cm). Non-spore bacteria (50 ÷ 97.9%) and bacilli (2.1 ÷ 50%) are included in the total anaerobic microflora. Anaerobes were not established for sites: SV 2 (moss + grass), PB 3 (moss top layer 0-7 cm), PB 3 '(moss + grass 0-7 (10) cm) and PUN-H2 (moss – top layer). Bacteria-absorbing mineral nitrogen in the absence of oxygen are best represented in CA 2 (under nest) and CA 1 (grass), their amount decreasing from 20 to 66.7 times in HPP B1 Bay (soil without vegetation), SV 1 (soil without vegetation), PB 3 '(moss + grass > 7 (10) cm), PB 1 (soil without vegetation), PUN-H2 (lichen), HPP 1 Skua (lichen). The poorer development of this group of microorganisms at all soil sites correlates with the lowest mineralisation rate of organic matter - MC values from 0.00 to 20.00. The highest mineralisation coefficient (2.58) was calculated for the soil under black lichen (HPP 1 Skua), despite the low amount of microorganisms at this site. It is therefore not always and not only the amount of micro-organisms that is a prerequisite for their activity. It is influenced by humidity, temperature, nutrients, soil pH, climatic conditions, vegetation type and other factors.
Anaerobic microorganisms occupy a significant part of the microbial communities in soils, except for 4 sites where their development is completely limited: SV 2 (soil under moss + grass), PB 3 (soil under moss top layer 0-7 cm), PB 3´ (soil under moss + grass 0-7 (10) cm), PUN-H2 (soil under moss – top layer). For other sites, the total amount of anaerobes with regard to the amount of aerobes varies from site to site.
The results show that the ratio of aerobes to anaerobes is highest in soils under lichen, ie. the amount of anaerobes decreases most strongly at these sites - from 29 times in soil under lichen to 48 times in soil under black lichen, as well as in sites with "moss + grass" vegetation cover - from the complete absence of anaerobes to a reduction of 24 times that of the aerobes. In most sites without vegetation, the development of anaerobes decreases 7 times, while in soils under mosses, it varies from 1 to 7 times at individual sites. The total microflora developing in the absence of oxygen decreases the least in all objects under grass (1-2 times), as well as in organogenic soil under nest (2 times). Oxygen concentration in soils is an important factor for the structure of the microbial community (
As indicated, the bacteria occupy a major part in the composition of common microflora, for both aerobes and anaerobes. Similar results have been obtained by other authors (
Conclusions
Soil biogenicity varies from site to site, depending on presence of vegetation cover and sampling depth. It is highest in soils with vegetation cover or dead plant residues (in descending order - moss, lichen, black lichen, grass, organogenic residues from nest). Different biogenicity in soils under the same vegetation is found, which shows the strong influence of the edaphic and climatic conditions of the environment. On the other hand, at the same site (JD 1), the lowest biogenicity of soils under grass and a significantly higher amount of microorganisms under moss were reported, which also indicates the influence of vegetation cover type on the development of microorganisms.
The predominantly non-spore-forming aerobic bacteria (in 81.8% of the samples) followed by actinomycetes (in 12.1% of the samples) are dominant in the composition of the total microflora. The rearrangement of the microorganisms in the composition of the total microflora by the rate of dominance indicates the participation of all studied groups of microorganisms in the initial and final stages of decomposition of organic matter.
Established R-strategists (fast-growing microorganisms) - ammonifying bacteria and bacteria-absorbing mineral nitrogen, as well as K-strategists (slow-growing microorganisms from all study groups) play a major role in the initial (R-strategists) and final (K-strategists) stages of organic matter decomposition in soils.
The pigmentation of air micelles in actinomycetes and micromycetes (brown, grey-green), as well as the carotenoid type of chromogenesis in bacteria-absorbing mineral nitrogen and ammonifying bacteria, is probably due to the good adaptation and protection of the species under extreme polar conditions. The formation of pigments is only found in aerobic species of micro-organisms. Probably the absence of oxygen impedes the formation of pigments in anaerobes.
Anaerobic microflora are also better developed in soils with vegetation cover and occupy a significant part of the microbial communities in soils. Again in the composition of the total amount of anaerobic microorganisms, non-spore-forming bacteria followed by bacilli occupy the highest percentage.
In most sites, the rate of organic matter decomposition is average in terms of the mineralisation coefficients and the quantitative development of the individual groups of microorganisms. The most active mineralisation is found in the soils with vegetation cover.
Acknowledgements
The authors thank Prof. Pimpirev and the members of the Bulgarian Antarctic Institute for the logistical support during the participation in the XXVII and XVIII polar expeditions to the Bulgarian Polar Base at Livingstone Island, Antarcica, realised in 2018 and 2019.
Funding program
The projects were funded by Bulgarian Antarctic Institute under the National Programme for Polar Researches 2017-2021 with CM Decision No. 718 / 29.08.2016. and by the National Science Fund under the Programme for BILATERAL PROJECTS – BULGARIA – RUSSIA 2018 -2019
Conflicts of interest
The authors declare no conflict of interests.
References
- Bacterial diversity associated with ornithogenic soil of the Ross Sea region, Antarctica.Canadian Journal of Microbiology55(1):21‑36. https://doi.org/10.1139/w08-126
- Bacterial composition of soils of the Lake Wellman area, Darwin Mountains, Antarctica.Extremophiles17(5):775‑786. https://doi.org/10.1007/s00792-013-0560-6
- Dominant bacteria in soils of Marble Point and Wright Valley, Victoria Land, Antarctica.Soil Biology and Biochemistry38(10):3041‑3056. https://doi.org/10.1016/j.soilbio.2006.02.018
- Relation between soil classification and bacterial diversity in soils of the Ross Sea region, Antarctica.Geoderma144:9‑20. https://doi.org/10.1016/j.geoderma.2007.10.006
- Distribution and abundance of soil fungi in Antarctica at sites on the Peninsula, Ross Sea Region and McMurdo Dry Valleys.Soil Biology and Biochemistry43(2):308‑315. https://doi.org/10.1016/j.soilbio.2010.10.016
- Microbial competition in polar oils: a review of an understudied but potentially omportant control on productivity.Biology2(2):533‑554. https://doi.org/10.3390/biology2020533
- Predictable bacterial composition and hydrocarbon degradation in Arctic soils following diesel and nutrient disturbance.The ISME Journal7(6):1200‑1210. https://doi.org/10.1038/ismej.2013.1
- Total number and biomass of soil microorganisms in the region of the Livingston Island, Bulgarian Antarctic Research, Life Science.2.Pensoft,20-25pp. [ISBN954-642-070-0]
- Soil fungal community composition at Mars Oasis, a southern maritime Antarctic site, assessed by PCR amplification and cloning.Fungal Ecology2(2):66‑74. https://doi.org/10.1016/j.funeco.2008.10.008
- Dichromate digestion–spectrophotometric procedure for determination of soil microbial biomass carbon in association with fumigation–extraction.Communications in Soil Science and Plant Analysis42(22):2824‑2834. https://doi.org/10.1080/00103624.2011.623027
- Functional ecology of an Antarctic dry valley.Proceedings of the National Academy of Sciences110(22):8990‑8995. https://doi.org/10.1073/pnas.1300643110
- Assessment of soil bacterial communities on Alexander Island (in the maritime and continental Antarctic transitional zone).Polar Biology35(3):387‑399. https://doi.org/10.1007/s00300-011-1084-0
- Patterns in the distribution of soil bacterial 16S rRNA gene sequences from different regions of Antarctica.Geoderma45‑55. https://doi.org/10.1016/j.geoderma.2012.02.017
- Microbial ecology and biogeochemistry of continental Antarctic soils.Frontiers in Microbiology5https://doi.org/10.3389/fmicb.2014.00154
- Soil fungal community composition does not alter along a latitudinal gradient through the maritime and sub-Antarctic.Fungal Ecology5(4):403‑408. https://doi.org/10.1016/j.funeco.2011.12.002
- Antibiotic complex, produced by an antarctic actinomycete strain S. anulatus 39 LBG09.Bulgarian Journal of Agricultural Science19(2):72‑76.
- Biodiversity of micro-eukaryotes in Antarctic Dry Valley soils with <5% soil moisture.Soil Biology and Biochemistry38(10):3107‑3119. https://doi.org/10.1016/j.soilbio.2006.01.014
- A thermophilic microorganism from Deception Island, Antarctica with a thermostable glutamate dehydrogenase activity.Biological Research51(1). https://doi.org/10.1186/s40659-018-0206-3
- The impact of different soil parameters on the community structure of dominant bacteria from nine different soils located on Livingston Island, South Shetland Archipelago, Antarctica.FEMS Microbiology Ecology76(3):476‑491. https://doi.org/10.1111/j.1574-6941.2011.01068.x
- Taxonomic study on thermophilic strain Imbas-11A, producer of secondary metabolites.Bulgarian Antarctic Research, Life Science3:29-34.
- Keratinase production by newly isolated Antarctic Actinomycete strains.World Journal of Microbiology and Biotechnology21:831‑834. https://doi.org/10.1007/s11274-004-2241-1
- Gushterova D, Noustorova M, Tzvetkova R, Spassov G, Chipeva V (1999) Investigation of the microflora in penguin excrements in the Antarctic. Bulgarian Antarctic Research, Life Science.2.Pensoft,1-7pp. [ISBN954-642-070-0].
- Investigation of the microflora in glaciers from the Antarctic.Bulgarian Antarctic Research, Life Science2:8‑12.
- Effects of water regime on archaeal community composition in Arctic soils.Environmental Microbiology8(6):984‑996. https://doi.org/10.1111/j.1462-2920.2006.00982.x
- The environmental basis of ecosystem variability in Antarctica: research in the Latitudinal Gradient Project.Antarctic Science22(6):591‑602. https://doi.org/10.1017/s0954102010000829
- Antibiotic complex from Streptomyces Flavovirens 67, Isolated from Livingston Island.Bulgarian Antarctic Research, Life Science3:35‑42.
- The abundance of microorganisms and substrate profile of heterotrophs from soils of different habitats of Livingston Island.Bulgarian Antarctic Research, Life Science3:15‑20.
- Bacterial diversity and community structure in polygonal tundra soils from Samoylov Island, Lena Delta, Siberia.International Microbiology : the Official Journal of the Spanish Society for Microbiology11(3):195‑202.
- Soil microbial communities of eastern Antarctica.Moscow University Biological Sciences Bulletin73(3):104‑112. https://doi.org/10.3103/s0096392518030124
- Photoprotective role of carotenoids in yeasts: Response to UV-B of pigmented and naturally-occurring albino strains.Journal of Photochemistry and Photobiology B: Biology95(3):156‑161. https://doi.org/10.1016/j.jphotobiol.2009.02.006
- Photoprotection by carotenoid pigments in the yeast Rhodotorula mucilaginosa: the role of torularhodin.Photochemical & Photobiological Sciences9(8). https://doi.org/10.1039/c0pp00009d
- Unexpectedly high bacterial diversity in Arctic tundra relative to boreal forest soils, revealed by serial analysis of ribosomal sequence tags.Applied and Environmental Microbiology71(10):5710‑5718. https://doi.org/10.1128/aem.71.10.5710-5718.2005
- Antarctic groups of microorganism.Journal of Balkan Ecology4(2):186‑192.
- Investigations of the microflora in glaciers from the Antarctic.Bulgarian Antarctic Researchq Life Sciences2:8‑12.
- Study of soils from the region of Livingston Island, Antarctica.Bulgarian Antarctic Research, Life Science3:21‑28.
- Izolation and taxonomic study of Antarctic yeasts from Livingston Island for exopolysaccharide producting.Bulgarian Antarctic Research, Life Science4:27‑34.
- Lipid composition and l-glucosidase production from Cryptococcus vishnlacii AL4.Bulgarian Antarctic Research, Life Science4:9‑22.
- Diversity of soil microbial communities in Livingston Island – Antarctica.Ecological Engineering Environmental Protection1:28‑35.
- Hydrocarbon contamination changes the bacterial diversity of soil from around Scott Base, Antarctica.FEMS Microbiology Ecology53(1):141‑155. https://doi.org/10.1016/j.femsec.2004.11.007
- Isolation and taxonomic investigation of yeast strains from the Antarctic.Bulgarian Antarctic Research, Life Science2:13‑19.
- Study on ecological properties of microflora and mesobiont fauna of soils polluted with heavy metals. Proceedings.Jubilee Scientific Conference of Ecology,Plovdiv.
- Abiotic factors influence microbial diversity in permanently cold soil horizons of a maritime-associated Antarctic Dry Valley.FEMS Microbiology Ecology82(2):326‑340. https://doi.org/10.1111/j.1574-6941.2012.01360.x
- The diversity, extracellular enzymatic activities and photoprotective compounds of yeasts isolated in Antarctica.Brazilian Journal of Microbiology42(3):937‑947. https://doi.org/10.1590/s1517-83822011000300012
- Evolutionary origins of Antarctic microbiota: invasion, selection and endemism.Antarctic Science12(3):374‑385. https://doi.org/10.1017/s0954102000000420
- Microbial ecosystems of Antarctica.Cambridge University Press,Cambridge,320pp.
- Vishniac HS (1993) The microbiology of Antarctic soils. In: Friedmann EI (Ed.) Antarctic Microbiology.Wiley-Liss,New York,297–341pp.
- Size and structure of bacterial, fungal and nematode communities along an Antarctic environmental gradient.FEMS Microbiology Ecology59(2):436‑451. https://doi.org/10.1111/j.1574-6941.2006.00200.x
- Patterns of bacterial diversity across a range of Antarctic terrestrial habitats.Environmental Microbiology9(11):2670‑2682. https://doi.org/10.1111/j.1462-2920.2007.01379.x
- Functional microarray analysis of nitrogen and carbon cycling genes across an Antarctic latitudinal transect.The ISME Journal1(2):163‑179. https://doi.org/10.1038/ismej.2007.24
- Environmental microarray analyses of Antarctic soil microbial communities.The ISME Journal3(3):340‑351. https://doi.org/10.1038/ismej.2008.111
- Shifts in soil microorganisms in response to warming are consistent across a range of Antarctic environments.The ISME Journal6(3):692‑702. https://doi.org/10.1038/ismej.2011.124