|
One Ecosystem :
Research Article
|
|
Corresponding author: Michael Bordt (mbordt@gmail.com)
Academic editor: Joachim Maes
Received: 06 Nov 2018 | Accepted: 25 Feb 2019 | Published: 28 Feb 2019
© 2019 Michael Bordt, Marc Saner
This is an open access article distributed under the terms of the Creative Commons Attribution License (CC BY 4.0), which permits unrestricted use, distribution, and reproduction in any medium, provided the original author and source are credited.
Citation:
Bordt M, Saner M (2019) Which ecosystems provide which services? A meta-analysis of nine selected ecosystem services assessments. One Ecosystem 4: e31420. https://doi.org/10.3897/oneeco.4.e31420
|
|
Abstract
For ecosystem measurement frameworks to be accepted, operationalised and implemented by diverse international communities, clear and agreeable concepts and classifications are essential. This paper analyses and develops two foundational typology challenges within ecosystem measurement: the classification of ecosystems and the classification of their services. Our aim is to determine if there is sufficient consensus to ascertain “Which ecosystems provide which services?” for standardised ecosystem accounting.
This paper first compares classifications used in nine selected ecosystem assessments as input studies that make value statements about multiple ecosystems providing multiple ecosystem services. Given that these nine studies do not use identical concepts, classifications and terminologies, we develop “supersets” that can accommodate the diversity of classifications used in these input studies. Each input study is then corresponded to these new supersets.
On the basis of this analysis, substantial consensus was found that some ecosystems are more likely to provide certain services than others are. However, for several ecosystem types, there was little or no consensus on which services they provide. Linkages for which there is consensus can serve as a checklist for future ecosystem services assessments. Both the framework of the supersets and the correspondence and visual methods developed will be useful for integrating information at different scales (for example, linkages from local, ecosystem-specific and ecosystem services-specific studies). This paper also provides guidance to future ecosystem services assessments to use, test and extend the current classifications of ecosystems and ecosystem services.
Keywords
Classification, Convergence, Environmental accounting, Environmental policy, Frameworks
Introduction
International standards for ecosystem accounting have only recently become a focus of interest (
Fostering national and international agreement on measurement systems requires convergence amongst value systems (see
The question of “Which ecosystems provide which services?” should be understood as a search for priorities. One can argue that ecosystems carry out many processes that are linked, directly or indirectly, to many ecosystem services—one may even claim that “all ecosystems provide all services.” This answer, however, does little to focus ecosystem services studies on priority ecosystems or priority ecosystem services in a study area.
Considering that existing ecosystem services studies implicitly or explicitly answer the question by identifying ecosystems and ecosystem services of interest, one may think that unified classification systems should already exist. Such systems would ideally provide a comprehensive and objective understanding of (a) which ecosystems potentially provide which services and (b) which services are potentially provided by which ecosystems. Detailed, rigorous and internationally-accepted classifications of both ecosystems and ecosystem services would provide a foundation for comparability across studies. While progress is being made on these (
When planning an ecosystem services study, one could begin with identifying ecosystems in the study area and then determining which services they provide. Alternatively, one could begin with identifying priority services and then determining which ecosystems are most likely to provide them. Either approach requires an understanding of which ecosystems provide which services. Such an understanding could be developed through exhaustive field research or by meta-analysis of existing knowledge. For example, a wetland in one location may have already been studied and determined to provide priority services of water purification, habitat and flood control. When studying a nearby wetland, one could gather basic information to verify the importance of these services, then focus new field research on measuring additional services such as food production and erosion protection. However, such local knowledge is often incomplete and primary field research is expensive and time-consuming. Furthermore, a highly local and contextual approach could directly contravene the global goal of data commensurability and aggregation. It is preferable, thus, to attempt a compromise that satisfies the need for aggregation based on all available knowledge that has been derived locally, nationally and globally.
Existing global ecosystem accounting frameworks provide a starting point. The System of Environmental Economic Accounting – Experimental Ecosystem Accounting (SEEA EEA) (
Integrating local and global knowledge into coherent ecosystem accounts requires an overarching concept of the “global whole” (all ecosystem types and all ecosystem services) within which results of local, detailed studies can be combined. To develop this concept of the “global whole”, we compare and integrate nine selected input studies that range in scope from local to global. We combine their insights into a classification proposal, evaluate the level of consensus on the relationships between specific ecosystems and specific ecosystem services and conclude with recommendations for practitioners to use, test and extend these concepts.
We are aware of recent advances in applying such systematic approaches to ecosystem assessments, such as those described by
Selected input studies
We selected the following nine input studies to provide the source material for the analysis. Selection was based on (a) their importance in the literature and (b) their inclusion ofan assessment of the relative importance of multiple ecosystem services being provided by multiple ecosystem types. If such an assessment were not explicitly presented in a table, as was the case for the the
Meta-analytical studies (input studies 1-2)
Input study 1: Table 2 in
Input study 2: Table 2 in
Neither of these meta-analyses is comprehensive, since they reflect only what was available in the source studies, which are subject to many biases. Not the least of these biases is selecting the services, ecosystems or beneficiaries deemed in advance to be the most “valuable”.
Global assessments (input studies 3-7)
Input study 3: The Millennium Ecosystem Assessment (
Input study 4:
Input study 5: The Economics of Ecosystems and Biodiversity (TEEB), is a global initiative aimed at mainstreaming the value of ecosystem services in national decision-making.
Input study 6: The Final Ecosystem Goods and Services Classification System (FEGS-CS) (
Input study 7:
Global assessments such as these tend to define global ecosystem types and ecosystem services broadly (e.g. forests, freshwater). In the case of the
Local and national assessments (input studies 8-9)
Input study 8: The United Kingdom National Ecosystem Assessment (UK NEA) (Figure 5 in
Input study 9:
Classifications resulting from local analyses may be less relevant to other geographic areas with different ecosystem types. For example,
Superset of ecosystem types
By integrating the nine input studies described above, we develop and discuss in this section an ecosystem classification that should provide a compromise between the need for detail at the local scale and the need for universality at national and global scales. While we do not claim to have achieved a “final” classification, it provides insights into further improving ecosystem classifications for ecosystem accounting. Our ecosystem superset contains 48 categories.
Ecosystem classifications in the input studies were based on different principles including reporting category (
According to
Land cover-based classifications of ecosystems are inadequate to represent elevations of terrestrial ecosystems and depths of aquatic ecosystems. This also raises questions about how to classify non-surface ecosystems such as those existing under water, in caves and in soil. Several input studies differentiate mountain ecosystems (
The Québec Centre for Biodiversity Science (QCBS) Working Group 14, in collaboration with the European Space Agency (ESA), created a detailed classification of land cover specifically to support ecosystem accounting*
- Dense (impermeable) and open (permeable) artificial surfaces;
- Annual and perennial crops;
- Treed wetlands and forest, highlighting the concern that wetlands are often not detectable from remote sensing;
- Coniferous, deciduous and mixed forest and three density categories for each;
- Several types of wetlands; and
- Deep and shallow freshwater bodies.
The proposed superset of ecosystem types (Table
Proposed superset of ecosystem types based on SEEA, expanded.
Source: Adapted from
1 Detectable by: H = High-resolution imagery (10-30 m), V = Very high resolution imagery (2.5-5 m), T = requires ground-truthing, N = not detectable. This is based on an assessment by the ESA.
2 Elevation / Depth variant: Y = Could exist at various elevations/depths (would require additional levels); N = elevation/depth included in definition.
|
Level 1 |
Level 2 |
Level 3 |
Level 4 |
Detectable by remote sensing1 |
Elevation / Depth variant2 |
|
01. Artificial surfaces (including urban and associated areas) |
01.01 Dense artificial surfaces |
H, V |
Y |
||
|
01.02 Open artificial surfaces |
H, V |
Y |
|||
|
01.03 Dams |
H, V |
Y |
|||
|
02. Herbaceous crops |
02.01 Annual crops |
V, T |
Y |
||
|
02.02 Perennial crops and pasture |
V, T |
Y |
|||
|
03. Woody crops |
T |
Y |
|||
|
04. Multiple or layered crops |
T |
Y |
|||
|
05. Grassland |
T (Natural / Cultivated) |
Y |
|||
|
06. Tree covered areas |
06.01 Treed wetlands |
06.01.01 Treed swamps |
H, T |
Y |
|
|
06.01.02 Treed peatlands |
H, T |
Y |
|||
|
06.02 Forest |
06.02.01 Coniferous forest |
06.02.01.01 Very dense coniferous forest |
H |
Y |
|
|
06.02.01.02 Dense coniferous forest |
H |
Y |
|||
|
06.02.01.03 Open coniferous forest |
H |
Y |
|||
|
06.02.02 Deciduous forest |
06.02.02.01 Very dense deciduous forest |
H |
Y |
||
|
06.02.02.02 Dense deciduous forest |
H |
Y |
|||
|
06.02.02.03 Open deciduous forest |
H |
Y |
|||
|
06.02.03 Mixed forest |
06.02.03.01 Very dense mixed forest |
H |
Y |
||
|
06.02.03.02 Dense mixed forest |
H |
Y |
|||
|
06.02.03.03 Open mixed forest |
H |
Y |
|||
|
07. Mangroves |
V |
N |
|||
|
08. Shrub covered areas |
V |
Y |
|||
|
09. Shrubs and/or herbaceous vegetation, aquatic or regularly flooded |
09.01 Aquatic or emergent marsh |
T |
Y |
||
|
09.02 Prairie marsh, riverwash |
T |
Y |
|||
|
09.03 Untreed peatland |
09.03.01 Fen |
T |
Y |
||
|
09.03.02 Bog |
T |
Y |
|||
|
09.04 Shrub swamp |
T |
Y |
|||
|
10. Sparsely natural vegetated areas |
10.01 Bryoids |
T |
Y |
||
|
10.02 Sparsely natural vegetated areas |
T |
Y |
|||
|
11. Terrestrial barren land |
H |
Y |
|||
|
12. Permanent snow and glaciers |
H |
Y |
|||
|
13. Inland water bodies |
13.01 Rivers and streams |
13.01.01 Deep water |
H, T |
Y |
|
|
13.01.02 Shallow water |
H, T |
Y |
|||
|
13.02 Lakes and ponds |
13.02.01 Deep water |
H, T |
Y |
||
|
13.02.02 Shallow water |
H, T |
Y |
|||
|
14. Coastal water bodies and inter-tidal areas |
14.01 Coastal water bodies |
14.01.01 Pelagic |
H |
N |
|
|
14.01.02 Benthic |
N |
N |
|||
|
14.02 Inter-tidal areas |
14.02.01 Lagoons |
H, V |
N |
||
|
14.02.02 Rocky shores |
H, V |
N |
|||
|
14.02.03 Beaches |
H, V |
N |
|||
|
14.02.04 Coral reefs |
N |
N |
|||
|
14.02.05 Seagrass beds |
N |
N |
|||
|
14.02.06 Estuaries |
H |
N |
|||
|
14.02.07 Coastal dunes |
V |
N |
|||
|
15. Open ocean |
15.01 Pelagic |
H |
N |
||
|
15.02 Benthic |
H, N |
N |
|||
|
16. Atmosphere |
N |
Y |
|||
|
17. Groundwater |
N |
Y |
|||
|
18. Soil |
N |
Y |
Substantial modifications to the
- 01.03 Dams*
5 was added, sinceMaynard et al. (2010) attribute services to urban dams (artificial water bodies created for the storage of water). This highlights the question of how urban features should be considered in an ecosystem classification. Several input studies distinguish greenspace within urban systems as providers of ecosystem services. - 07 Mangroves was added here to maintain high-level compatibility with the SEEA CF. However, this type would be better classified as a subset of 14.02 Intertidal water bodies, since mangroves exist uniquely in saline coastal habitats (
Valiela et al. 2001 ). - 13 Inland water bodies was expanded to distinguish “Rivers and streams” from “Lakes and ponds”, since several input studies (
Landers and Nahlik 2013 ,Maynard et al. 2010 ,TEEB 2010 ) identify different ecosystem services from these types. - 14 Coastal water bodies and inter-tidal areas was expanded to include the different types of coastal water bodies and inter-tidal areas used in the input studies. For example,
Maynard et al. (2010) distinguish “Pelagic” (surface) from “Benthic” (sea bottom) coastal water bodies. For “Inter-tidal areas”, several authors distinguish types, such as “Rocky shores”, “Beaches”, “Coral reefs”, “Seagrass beds”, “Estuaries” and “Coastal dunes”. - 15 Open ocean was added, since most input studies included an open ocean or marine type. This was further differentiated into “Pelagic” and “Benthic” by the author.
- 16 Atmosphere is used only by
Landers and Nahlik (2013) as an environmental sub-class. It is not, in fact, an ecosystem (Cooter et al. 2013 ). "Atmosphere" is, however, of interest since it is not only an integral part of almost all ecosystems, it also engages in processes, such as airflow, that are distinct from the ecosystems with which it interacts. - 17 Groundwater is also used only by
Landers and Nahlik (2013) . "Groundwater" is neither a surface feature, nor an ecosystem type, but is also of interest due to its distinct processes that interact with ecosystems. - 18 Soil (
United States Department of Agriculture 2016 ) was added to emphasise that distinct ecosystems exist in soil (Brady and Weil 2010 ), but are not commonly considered in ecosystem services assessments.
The development of the proposed superset of ecosystem types (Table
The input studies did not always include detailed definitions of the ecosystem classification. For example,
Furthermore, several input studies included ecosystem types that were not specifically land cover types, but were distinguished by location (tropical vs. temperate forest), conditions (e.g. tundra, desert, urban) or elevation (mountain). Specifically:
- Several input studies (
Costanza et al. 1997 ,de Groot et al. 2012 ,Kinzig et al. 2007 ,TEEB 2010 ) include deserts or tundra, which were corresponded to both 10 Sparsely natural vegetated areas and 11 Terrestrial barren land. - Some input studies (
Costanza et al. 1997 ,de Groot et al. 2012 ,Kinzig et al. 2007 ,TEEB 2010 ) distinguish tropical from temperate forest, both of which were corresponded to 06.02 Forest. - "Urban areas" were included in most of the input studies, but definitions ranged from hard surfaces only to greenspace only. When definitions were available, urban areas were corresponded to the appropriate ecosystem type. For example, the
Landers and Nahlik (2013) category of “Created greenspace” (parks and lawns) was corresponded to 05 Grasslands and all three types of open forest. - Mountain ecosystems (
Kinzig et al. 2007 ,MA 2005 ,Maynard et al. 2010 ,TEEB 2010 ) were corresponded to 10 Sparsely natural vegetated areas and 11 Terrestrial barren land, since the intent was to distinguish areas of limited ecosystem function. This is not entirely satisfactory, since most ecosystem types (forests, rivers & streams, lakes & ponds, grasslands etc.) also exist on mountains.
Broad ecosystem types, described in the input studies, required corresponding to several types in the superset. For example:
- The Millennium Ecosystem Assessment (
MA 2005 ) reporting category of “Natural grasslands/savannah/shrublands” was corresponded to 05 Grassland, 08 Shrub covered areas and 10 Sparsely natural vegetated areas. - Similarly, the FEGS-CS (
Landers and Nahlik 2013 ) environmental class “Scrublands/Shrublands” was corresponded to 08 Shrub covered areas and 10 Sparsely natural vegetated areas.
The
To manage the complexity of the comparisons, the resulting superset excludes some vertical (e.g. mountain vs. lowland) and latitudinal (e.g. tropical vs boreal) distinctions, “Islands” as a distinct type and local ecosystem types.
Superset of ecosystem service types
As with the superset of ecosystem types, the objective of this section is not to develop an ideal comprehensive classification of ecosystem services. Instead, we aim at comparing the ecosystem services classifications used in the nine input studies. Following CICES V4.3, we use 48 categories of ecosystem services which is, coincidentaly, the same number that emerged from the analysis of ecosystems.
Defining and classifying ecosystem services has progressed since many of the input studies were published.
FEGS-CS links “final” ecosystem goods and services (FEGS) to specific environmental classes and beneficiaries. Since it applies a conservative approach to identifying and classifying “final” ecosystem services, it excludes several that are often considered ecosystem services in the input studies, such as "Cultivated crops" and "Animals from in-situ aquaculture", since these are not “self-sustaining in the environment”
CICES V4.3 (
Since the 48 “Classes” (detailed ecosystem service types) of CICES V4.3 aligned well with the nine input studies, we used this existing classification as the ecosystem services superset to compare the nine input studies in this paper (Table
Superset of ecosystem services according to CICES V4.3 (CICES 2013)
Source: CICES (2013). Numeric codes added by the author.
|
Section |
Division |
Group |
Class |
|
01. Provisioning Services |
01.01 Nutrition |
01.01.01 Biomass |
01.01.01.01 Cultivated crops |
|
01.01.01.02 Reared animals and their outputs |
|||
|
01.01.01.03 Wild plants, algae and their outputs |
|||
|
01.01.01.04 Wild animals and their outputs |
|||
|
01.01.01.05 Plants and algae from in-situ aquaculture |
|||
|
01.01.01.06 Animals from in-situ aquaculture |
|||
|
01.01.02 Water |
01.01.02.01 Surface water for drinking |
||
|
01.01.02.02 Ground water for drinking |
|||
|
01.02 Materials |
01.02.01 Biomass |
01.02.01.01 Fibres and other materials from plants, algae and animals for direct use or processing |
|
|
01.02.01.02 Materials from plants, algae and animals for agricultural use |
|||
|
01.02.01.03 Genetic materials from all biota |
|||
|
01.02.02 Water |
01.02.02.01 Surface water for non-drinking purposes |
||
|
01.02.02.02 Ground water for non-drinking purposes |
|||
|
01.03 Energy |
01.03.01 Biomass-based energy sources |
01.03.01.01 Plant-based resources |
|
|
01.03.01.02 Animal-based resources |
|||
|
01.03.02 Mechanical energy |
01.03.02.01 Animal-based energy |
||
|
02. Regulation & Maintenance |
02.01 Mediation of waste, toxics and other nuisances |
02.01.01 Mediation by biota |
02.01.01.01 Bio-remediation by micro-organisms, algae, plants and animals |
|
02.01.01.02 Filtration / sequestration / storage / accumulation by micro-organisms, algae, plants and animals |
|||
|
02.01.02 Mediation by ecosystems |
02.01.02.01 Filtration / sequestration / storage / accumulation by ecosystems |
||
|
02.01.02.02 Dilution by atmosphere, freshwater and marine ecosystems |
|||
|
02.01.02.03 Mediation of smell/noise/visual impacts |
|||
|
02.02 Mediation of flows |
02.02.01 Mass flows |
02.02.01.01 Mass stabilisation and control of erosion rates |
|
|
02.02.01.02 Buffering and attenuation of mass flows |
|||
|
02.02.02 Liquid flows |
02.02.02.01 Hydrological cycle and water flow maintenance |
||
|
02.02.02.02 Flood protection |
|||
|
02.02.03 Gaseous / air flows |
02.02.03.01 Storm protection |
||
|
02.02.03.02 Ventilation and transpiration |
|||
|
02.03 Maintenance of physical, chemical, biological conditions |
02.03.01 Lifecycle maintenance, habitat and gene pool protection |
02.03.01.01 Pollination and seed dispersal |
|
|
02.03.01.02 Maintaining nursery populations and habitats |
|||
|
02.03.02 Pest and disease control |
02.03.02.01 Pest control |
||
|
02.03.02.02 Disease control |
|||
|
02.03.03 Soil formation and composition |
02.03.03.01 Weathering processes |
||
|
02.03.03.02 Decomposition and fixing processes |
|||
|
02.03.04 Water conditions |
02.03.04.01 Chemical condition of freshwaters |
||
|
02.03.04.02 Chemical condition of salt waters |
|||
|
02.03.05 Atmospheric composition and climate regulation |
02.03.05.01 Global climate regulation by reduction of greenhouse gas concentrations |
||
|
02.03.05.02 Micro and regional climate regulation |
|||
|
03. Cultural Services |
03.01 Physical and intellectual interactions with biota, ecosystems and land-/seascapes [environmental settings] |
03.01.01 Physical and experiential interactions |
03.01.01.01 Experiential use of plants, animals and land- / seascapes in different environmental settings |
|
03.01.01.02 Physical use of land- / seascapes in different environmental settings |
|||
|
03.01.02 Intellectual and representative interactions |
03.01.02.01 Scientific |
||
|
03.01.02.02 Educational |
|||
|
03.01.02.03 Heritage, cultural |
|||
|
03.01.02.04 Entertainment |
|||
|
03.01.02.05 Aesthetic |
|||
|
03.02 Spiritual, symbolic and other interactions with biota, ecosystems and land-/seascapes [environmental settings] |
03.02.01 Spiritual and/or emblematic |
03.02.01.01 Symbolic |
|
|
03.02.01.02 Sacred and / or religious |
|||
|
03.02.02 Other cultural outputs |
03.02.02.01 Existence |
||
|
03.02.02.02 Bequest |
Different levels of detail between the input studies and CICES required corresponding ecosystem service to CICES classes. For example:
- CICES Classes 01.01.02.01 Surface water for drinking, 01.01.02.02 Groundwater for drinking, 01.02.02.01 Surface water for non-drinking purposes and 01.02.02.02 Groundwater for non-drinking purposes were frequently not distinguished in the input studies. Most input studies used one ecosystem service type for water supply, whether it was for drinking or for non-drinking purposes.
-
CICES Class 01.02.01.01 Fibres and other materials from plants, algae and animals for direct use or processing was represented by
de Groot et al. (2012) as three services (“Raw materials”, “Medicinal resources”, “Ornamental resources”), byLanders and Nahlik (2013) as four categories (“Fiber”, “Natural materials”, “Timber”, “Fungi”) and byKinzig et al. (2007) as three ecosystem services (“Fiber”, “Biochemicals and pharmaceuticals”, “Ornamental resources”). -
CICES Classes 02.01.01.01 Bio-remediation by micro-organisms, algae, plants and animals, 02.01.01.02 Filtration/sequestration/storage/accumulation by micro-organisms, algae, plants and animals, and 02.01.02.01 Filtration/sequestration/storage/accumulation by ecosystems are also not distinguished in the input studies.
-
CICES Class 02.03.01.02 Maintaining nursery populations and habitats was distinguished in further detail by
de Groot et al. (2012) (into “Nursery service” and “Genetic diversity”) andTEEB (2010) (into “Habitat for species” and “Maintenance of genetic diversity”). Classes used by other authors for “Wild species diversity” (DEFRA 2011 ) and “Iconic species” (Maynard et al. 2010 ) were corresponded to this class. -
CICES Classes 02.03.03.01 Weathering processes and 02.03.03.02 Decomposition and fixing processes were not distinguished in the input studies. “Soil formation” and “Nutrient cycling” (Costanza et al. 1997), “Erosion prevention and maintenance of soil fertility” (
TEEB (2010) ), “Soil quality” (DEFRA 2011 ), “Arable land” and “Productive soils” (Maynard et al. 2010 ) were corresponded to this class. -
CICES Classes 03.01.01.01 Experiential use of plants, animals and land-/seascapes in different environmental settings and 03.01.01.02 Physical use of land-/seascapes in different environmental settings were also not distinguished in the input studies. Several input studies did provide more detailed ecosystem services types: FEGS-CS (
Landers and Nahlik (2013) suggest “Presence of the environment”, “Open space”, “Viewscapes”, “Sounds and scents”; (DEFRA 2011 ) suggests “Environmental settings: landscapes/seascapes”, and “Environmental settings: Local places”; suggest “Iconic species”, “Inspiration”, “Sense of place”, “Iconic landscapes” and “Therapeutic landscapes”. -
CICES Classes 03.02.02.01 Existence and 03.02.02.02 Bequest were not specified in any input study. However, the very general class of “Cultural” in
Costanza et al. (1997) and “Presence of the environment” in FEGS-CS (Landers and Nahlik 2013 ) were corresponded to these classes.
Consensus matrix
The consensus matrix combines the ecosystems superset (48 categories) as rows and the ecosystem services superset (48 categories) as columns. The content of this matrix is provided by the nine input studies. Each input study includes statements (such as measures of monetary and physical values or expert judgements) of the importance of specific ecosystem types to specific ecosystem services. The number of input studies that consider a specific ecosystem type as important to providing a specific ecosystem service class indicates the degree of consensus on that linkage. Given that there are nine input studies, the degree of consensus, what we call “Consensus level”, can range from Consensus Level 0 (no study considers the linkage as important) to Consensus Level 9 (all nine studies consider the linkage as important). In our study, Consensus Level 8 was the maximum observed.
Statements about ecosystem/ecosystem service linkages in each input study were first corresponded to the ecosystem and ecosystem service supersets. For example, the
Secondly, since metrics, used by the input studies to state the importance of ecosystem/ecosystem service linkages, differed between input studies, this required a means of selecting the “important” linkages from each input study. Table
Criteria for selecting “important” ecosystem/ecosystem service linkages for the consensus matrix.
|
Input study (#) |
Criteria |
|
(1) |
> $68 per hectare (statistical median of all ecosystem type by ecosystem service combinations) |
|
(2) |
> $200 per hectare (statistical median of all ecosystem type by ecosystem service combinations) |
|
(3) FEGS-CS ( |
All FEGS “triplets” (combination of environmental sub-types by FEGS categories by beneficiary types) are considered "important" |
|
(4) |
“Medium” and “High” values (qualitatively defined in the input study) |
|
(5) |
> 155 (median of the product of ecosystem/function values by function/service) |
|
(6) The Millennium Ecosystem Assessment ( |
"Medium" (1) and "High" (2) values in Annex Table 1 - Suppl. material |
|
(7) |
“High” values (qualitatively defined in the input study) |
|
(8) |
All links mentioned (“y” in Annex Table 2 - Suppl. material |
|
(9) UK NEA ( |
“Medium high” and “High” values (qualitatively defined in the input study) |
To facilitate comparison of input studies with different levels of granularity (i.e. coarseness of classifications), if there were no statements about lower level (more detailed) classes, then statements about higher-level (less detailed) classes were attributed to lower levels. For example, if an input study included statements about 06.02 Forests and not about lower levels (such as 06.02.01 Coniferous forest), the same statement about forests was attributed to all lower levels.
The summary consensus matrix (Fig.
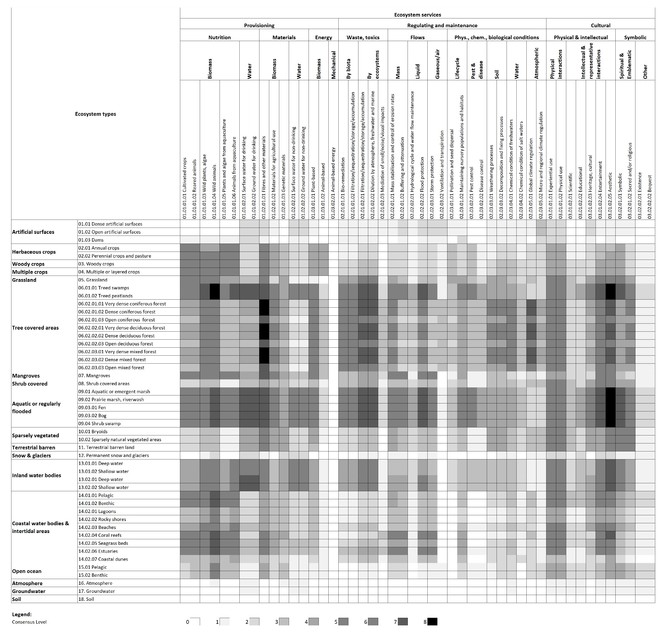
Summary consensus matrix shoring the Consensus Level—the number of input studies agreeing on the importance of a given ecosystem/ecosystem service linkage.
Note: Ecosystem services (columns) are CICES V4.3 classes, ecosystem types (rows) are SEEA classes with additional detail. See Tables
At first glance, Fig.
Consensus Level 8 was achieved on the importance of (a) wetlands providing wild animals and aesthetic services and (b) dense forests providing fibres and other materials (Table
Highest consensus on “Which ecosystem provides which services?”: Consensus Level 8 (8 of 9 studies agree on the linkage between ecosystem type and ecosystem service)
|
Ecosystem type |
Ecosystem service class |
|
|
Wetlands (06.01 Treed wetlands) |
06.01.01 Treed swamps |
01.01.01.04 Wild animals and their outputs |
|
03.01.02.05 Aesthetic |
||
|
06.01.02 Treed peatlands |
01.01.01.04 Wild animals and their outputs |
|
|
03.01.02.05 Aesthetic |
||
|
Forests (06.02 Forest) |
06.02.01.01 Very dense coniferous forest 06.02.01.02 Dense coniferous forest 06.02.02.01 Very dense deciduous forest 06.02.02.02 Dense deciduous forest 06.02.03.01 Very dense mixed forest 06.02.03.02 Dense mixed forest |
01.02.01.01 Fibres and other materials from plants, algae and animals for direct use or processing |
|
Wetlands (09 Shrub covered and/or herbaceous vegetation, aquatic or regularly flooded) |
09.01 Aquatic or emergent marsh 09.02 Prairie marsh, riverwash 09.03.01 Fen 09.03.02 Bog 09.04 Shrub swamp |
03.01.02.05 Aesthetic |
Consensus Level 4 (see Annex Table 7 -Suppl. material
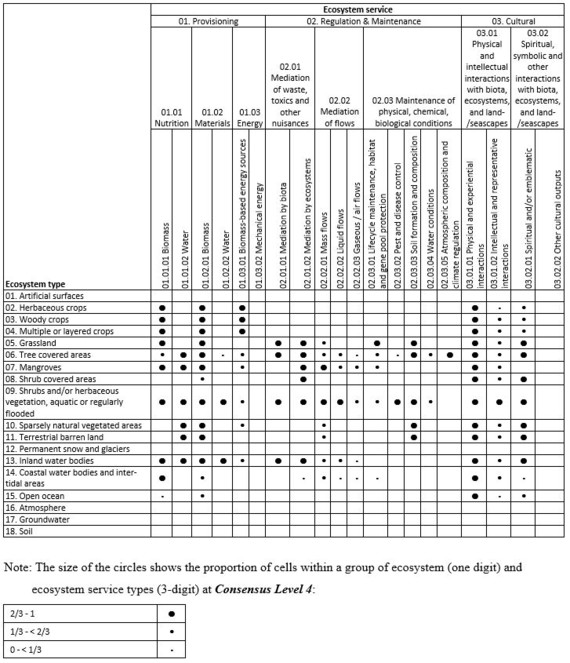
Ecosystem types providing the greatest number of services include 06 Tree covered areas and 09 Shrub and/or herbaceous vegetation, aquatic or regularly flooded. At this level of aggregation, both include wetlands.
Ecosystem services that are provided by a majority of the ecosystem types include:
- 01.01.01 Biomass (Nutrition),
- 01.02.01 Biomass (Materials),
- 03.01.01 Physical and experiential interactions,
- 03.01.02 Intellectual and representative interactions and
- 03.02.01 Spiritual and/or emblematic.
Discussion
Input studies
Each input study was found to embed substantial knowledge on which ecosystems provide which services, but none provides a comprehensive, global classification of ecosystem types and ecosystem services suitable for national ecosystem accounting. Comparing them illustrates gaps that may be due to local specificity, path dependency (basing a study on previous classifications and available data) or methodological bias (following a method through to its logical conclusion). This is simply an indication that the studies were not meant to provide comprehensive, global classifications of ecosystem types and ecosystem services that would be applicable at multiple scales.
Meta-analyses, by their nature, are limited to previously-published studies. These studies, themselves, reflect selection biases. That is, not all ecosystems and all ecosystem services have received equal attention.
Global studies were found to apply generic ecosystem types and often, generic service types. This may be necessary to reflect the global scale, but may not be seen as sufficiently detailed or rigorous for local and national ecosystem accounting. The FEGS-CS, in contrast, does provide rigorous definitions and a context-specific classification of “final” ecosystem services.
Local studies may develop or apply classifications that, if not well-defined, would be difficult to compare with other local studies or global studies. Furthermore, without comprehensive, hierarchical and detailed classifications, information from local studies would be difficult to aggregate to the national level. A standard international statistical classification (
Superset of ecosystem types
The superset developed reflects the ecosystem types used in the input studies. Some contained additional detail, such as mountain ecosystems, temperate versus tropical forests and benthic versus pelagic marine ecosystems. The "superset" did not attempt to capture this detail, since it would have required a 6-digit classification.
Superset of ecosystem service types
The nine input studies used ecosystem service types that were sometimes broader than the superset. This required several one-to-many correspondences to be able to compare them. An international statistical classification should ideally be sufficiently detailed to capture national and local variants.
Limitations of the study
As noted in the introduction, the approach to this analysis was to conduct a case study, based on ecosystem service assessments that assessed the importance of multiple ecosystem types to providing multiple ecosystem services. At the time of writing, these nine were considered sufficient to establish a broad consensus. Analysing more and newer input studies may have resulted in a richer analysis.
The input studies ranged widely in their coverage of the "supersets". For example,
On a related issue, several input studies were based on previous studies. For example,
Several assumptions were made in mapping ecosystem types and ecosystem services from the input studies to the supersets, especially when the descriptions in the input studies were not sufficiently detailed. Other researchers will likely have made different judgements.
Recommendations and conclusions
Recommendations on ecosystem classification
The new ecosystem type “superset” developed in this paper is a useful starting point for a universal classification that facilitates the identification of the linkages between priority ecosystem types and priority ecosystem services. Future ecosystem services assessments could use, test and contribute to further detailing the classification. Comparing such assessments would be facilitated by the explicit recognition of a hierarchical classification, standard terminology and the inclusion of soil as an ecosystem type. Testing and improving the classification would contribute to the establishment of international standard classifications for ecosystem accounting. We offer three recommendations on ecosystem classification:
Recommendation 1: Use a hierarchical classification
To be coherent and comprehensive, ecosystem accounting needs explicit definitions of what is included in each ecosystem category and which ones are subsets of others. This requires a hierarchical classification that is based on consistent criteria. However, the SEEA is a useful starting point. Ecosystem types used in the input studies are largely based on surface features, but several include mixes of location (such as temperate/tropical, islands or urban) and elevation or depth (mountainous, benthic/pelagic, seagrass beds, coral reefs). Since these are not surface features, double counting or inadvertent exclusion is possible. Location and depth subclasses could be added to a primary classification based on surface features.
Recommendation 2: Be explicit about what is included by using standard terminology
Imprecise terminology impedes developing correspondences between classification systems. Terms such as “floodplains”, “coastal systems”, “woodlands”, “urban”, “tidelands”, “desert”, “tundra”, “moorlands” and “heaths” do not correspond to standard surface features and thus are not easily corresponded to standard terminology.
If non-standard terms must be used, then an explicit definition corresponding to surface features, location and elevation/depth should be provided. The Food and Agriculture Organization (FAO) Land Cover Classification System (LCCS) (
Recommendation 3: Include atmosphere, groundwater and soil as explicit ecosystem types
CICES V4.3 and V5.1 both include abiotic services provided by the atmosphere (dispersion and dilution of waste) and groundwater (provision of water) and biotic services provided by soil (filtration of waste). Including these in ecosystem type classifications would provide an ecosystem type to associate with these services.
Soil is not included as an ecosystem type in any of the input studies. FEGS-CS (
Recommendations on ecosystem services classification
A more substantial challenge in integrating ecosystem services studies is the lack of an internationally-accepted, comprehensive and detailed classification of ecosystem services (
Recommendation 4: Use CICES and FEGS-CS together
CICES V4.3 and FEGS-CS overlap for many of the “final” ecosystem services (
Recommendation 5: Add detail and precise definitions to CICES
While CICES V4.3*
- Additional detail in some classes (e.g., 01.02.01.01 Fibres and other materials from plants, algae and animals for direct use or processing) would be useful to distinguish between different sources, producers and uses, such as fibres from plants for direct use,
- Recognition that several classes (e.g., 02.03.03.01 Weathering processes) may be less directly enjoyed, consumed or used by people and
- Recognition that several classes (e.g., 01.01.01.01 Cultivated crops) are less strongly linked to ecosystem processes.
Conclusions
None of the nine input studies provides classifications of ecosystems or ecosystem services that are sufficiently comprehensive, systematic and detailed for national ecosystem accounting.
There is consensus across these studies only on the importance of a minority of all possible ecosystems/ecosystem services linkages. Eight out of nine input studies agreed on only 15 (0.7%) of the possible linkages (wetlands provide wild animals and aesthetic services and dense forests provide fibres and other materials). The fact that 88% of all possible linkages (2,108 out of a mathematical maximum of 2,304) are considered important by at least one input study, indicates that the lack of consensus is due to the narrow scope of the input studies and granularity of the classifications they used.
Results of future assessments, such as the ones in the input studies, would be easier to integrate if they applied more rigorous, detailed and conceptually-expanded classifications of both ecosystems and ecosystem services. Recognising four different “kinds” of ecosystem services (directly/less directly used, strongly/weakly linked to ecosystem processes) (
Additional insights would be gained in future meta-analyses, such as the one described in this paper, by incorporating studies that focus on (a) specific ecosystem types, such as forests (
The analysis, summarised in this paper and shown in detail in the annex tables, should help move the search for a consensus compromise forward. Unified classifications will not only much improve our ability to aggregate local studies into national and international ecosystem accounts, they will also help decision-makers to select priority ecosystems or ecosystem services for assessment and monitoring efforts.
Acknowledgements
The first author would like to thank the World Bank, United Nations Statistics Division, The Government of Canada and the Québec Centre for Biodiversity Sciences (QCBS) Working Group 14 for providing opportunities to be engaged in the growing community of practice of ecosystem accounting. He is also indebted to my PhD Examination Committee (Konrad Gajewski, Anthony Heyes, Jackie Dawson, Kai ML Chan) for their many constructive comments on earlier drafts of this paper.
Hosting institution
Department of Geography, Environment and Geomatics; University of Ottawa, 75 Laurier Ave E, Ottawa, ON K1N 6N5, Canada
References
- The value of estuarine and coastal ecosystem services.Ecological Monographs81(2):169‑193. https://doi.org/10.1890/10-1510.1
- Research in Progress: Opportunities for soil science in ecosystem accounting.ResearchGateURL: https://www.researchgate.net/publication/260894943_Research_in_progress_Opportunities_for_soil_science_in_ecosystem_accounting
- Advancing Environmental-Economic Accounting Concept Note on Global Land Cover for Policy Needs: Supporting SDG Monitoring and Ecosystem Accounting.Presented at the GEO-XII Plenary (Land Cover Side Event). Mexico City, Nov. 15, 2015.URL: http://www.earthobservations.org/uploads/425_geo12_land_cover_side_event_concept_note.pdf
- Concordance between FEGS-CF and CICES V4.3.Presented at the Expert group meeting - Towards a standard international classification on ecosystem services. New York, June 20-21, 2016.URL: https://unstats.un.org/unsd/envaccounting/workshops/ES_Classification_2016/FEGS_CICES_Concordance_V1.3n.pdf
- What are ecosystem services? The need for standardized environmental accounting units.Ecological Economics63(2):616‑626. https://doi.org/10.1016/j.ecolecon.2007.01.002
- Elements of the nature and properties of soils.Pearson Educational International, Upper Saddle,River, NJ.
- Where are cultural and social in ecosystem services? A framework for constructive engagement.Bioscience62(8):744‑756. https://doi.org/10.1525/bio.2012.62.8.7
- Opinion: Why protect nature? Rethinking values and the environment.Proceedings of the National Academy of Sciences. 113 (6), 1462-1465. https://doi.org/10.1073/pnas.1525002113
- The Common International Classification of Ecosystem Services.Retrieved from www.cices.eu.
- The role of the atmosphere in the provision of ecosystem services.Science of The Total Environment448:197‑208. https://doi.org/10.1016/j.scitotenv.2012.07.077
- The value of the world’s ecosystem services and natural capital.Nature387:253‑260. https://doi.org/10.1038/387253a0
- The UK National Ecosystem Assessment - Synthesis of Key Findings.UK DEFRAURL: http://uknea.unep-wcmc.org/Resources/tabid/82/Default.aspx
- Valuing wetlands: guidance for valuing the benefits derived from wetland ecosystem services.Montreal, Canada: Ramsar Convention Secretariat, Gland, Switzerland & Secretariat of the Convention on Biological Diversity, Ramsar technical report No. 3/CBD Technical Series No. 27.
- Global estimates of the value of ecosystems and their services in monetary units.Ecosystem Services1(1):50‑61. https://doi.org/10.1016/j.ecoser.2012.07.005
- The IPBES Conceptual Framework — connecting nature and people.Current Opinion in Environmental Sustainability14:1‑16. https://doi.org/10.1016/j.cosust.2014.11.002
- Di Gregorio A (2005) Land cover classification system: classification concepts and user manual: LCCS. Food & Agriculture Org.URL: http://www.fao.org/docrep/008/y7220e/y7220e00.HTM
- Towards a consistent approach for ecosystem accounting.Ecological Economics90:41‑52. https://doi.org/10.1016/j.ecolecon.2013.03.003
- Common International Classification of Ecosystem Services (CICES) V5.1 and Guidance on the Application of the Revised Structure.www.cices.eu. Accessed on: 2018-10-26.
- Consultation on CICES Version 4, August-December 2012. (Vol. EEA Framework Contract No: EEA/IEA/09/003).European Environment Agency.
- Hancock A (2013) Best Practice Guidelines for Developing International Statistical Classifications (No. ESA/STAT/AC.267/5). Expert Group Meeting on International Statistical Classifications New York, 13-15 May 2013.
- Spatial scales, stakeholders and the valuation of ecosystem services.Ecological Economics57(2):209‑228. https://doi.org/10.1016/j.ecolecon.2005.04.005
- How do we value our reefs? Risks and tradeoffs across scales in “biomass-based”? economies.Coastal Management39(4):358‑376. https://doi.org/10.1080/08920753.2011.589219
- Ecosystem services and the economics of biodiversity conservation.Arizona State University,Tempe, AZ. URL: http://www.public.asu.edu/~cperring/Kinzig%20Perrings%20Scholes%20(2007).pdf
- Final ecosystem goods and services classification system.U.S. Environmental Protection Agency, Office of Research and DevelopmentEPA/600/R-13/ORD-004914URL: https://gispub4.epa.gov/FEGS/FEGS-CS%20FINAL%20V.2.8a.pdf
- Economic value of marine ecosystem services in Zanzibar: Implications for marine conservation and sustainable development.Ocean & Coastal Management52(10):521‑532. https://doi.org/10.1016/j.ocecoaman.2009.08.005
- Spatial and temporal trends of global pollination benefit.PLoS One7(4):35954‑35954. https://doi.org/10.1371/journal.pone.0035954
- Millennium Ecosystem Assessment. Ecosystems and Human Well-being: A Framework for Assessment: Summary.Island Press, Washington, DC.
- The development of an ecosystem services framework for South East Queensland.Environmental Management45(5):881‑895. https://doi.org/10.1007/s00267-010-9428-z
- Protecting Our Environmental Wealth: Connecting Ecosystem Goods and Services to Human Well-Being.Ecosystems and Human Well-being: multi-scale assessments. Millenium Ecosystem Assessment Series4:43‑60.
- Ecosystem Services: Accounting Standards.Science342(6157):420‑420. https://doi.org/10.1126/science.342.6157.420-a
- Toolkit for Ecosystem Service Site-based Assessment (TESSA).Version 1.1.URL: http://www.niney.org/showcase/rain/downloads/TESSAToolkit-V1_1-20130927.pdf
- Monetary accounting of ecosystem services: A test case for Limburg province, the Netherlands.Ecological Economics112:116‑128. https://doi.org/10.1016/j.ecolecon.2015.02.015
- Marine regime shifts: drivers and impacts on ecosystems services.Philosophical Transactions of the Royal Society of London B: Biological Sciences370(1659):20130273. https://doi.org/10.1098/rstb.2013.0273
- Sustainable intensification of agriculture for human prosperity and global sustainability.Ambio46(1):4‑17. https://doi.org/10.1007/s13280-016-0793-6
- Marine and Coastal Cultural Ecosystem Services: knowledge gaps and research priorities.One Ecosystem2:e12290. https://doi.org/10.3897/oneeco.2.e12290
- Exploring operational ecosystem service definitions: The case of boreal forests.Ecosystem Services14:144‑157. https://doi.org/10.1016/j.ecoser.2015.03.006
- Building the consensus: The moral space of Earth measurement.Ecological Economics130:74‑81. https://doi.org/10.1016/j.ecolecon.2016.06.019
- Accounting for capacity and flow of ecosystem services: A conceptual model and a case study for Telemark, Norway.Ecological Indicators36:539‑551. https://doi.org/10.1016/j.ecolind.2013.09.018
- National Ecosystem Assessments in Europe: A Review.BioScience66(10):813‑828. https://doi.org/10.1093/biosci/biw101
- TEEB for local and regional policy makers.TEEB, GenevaURL: http://www.teebweb.org/publication/teeb-for-local-and-regional-policy-makers-2/
- Guidance manual for TEEB country studies.TEEB, GenevaURL: http://www.teebweb.org/resources/guidance-manual-for-teeb-country-studies/
- Classification Uniformisee de la Couverture Terrestre pour une Comptabilite des Terres et des Ecosystemes / Standardized Land Cover Classification for Land and Ecosystem Accounting.Presented at the 36th Canadian Symposium on Remote Sensing. Canadian Remote Sensing Society. St. John's Newfoundland.
- System of Environmental-Economic Accounting 2012 - Central Framework.United Nations Statistics Division, New York.
- System of Environmental-Economic Accounting 2012 - Experimental Ecosystem Accounting.United Nations Statistics, New York.
- Transforming our world: the 2030 Agenda for Sustainable Development. https://sustainabledevelopment.un.org/post2015/transformingourworld. Accessed on: 2018-11-03.
- Advancing the System of Environmental-Economic Accounting (SEEA) Experimental Ecosystem Accounting: Expert Forum Minutes.UNSD/UNEP/CBD, New York.
- Technical Recommendations in support of the System of Environmental-Economic Accounting 2012–Experimental Ecosystem Accounting. https://seea.un.org/ecosystem-accounting. Accessed on: 2018-11-03.
- What is Soil?United States Department of AgricultureURL: https://www.nrcs.usda.gov/wps/portal/nrcs/detail/soils/edu/?cid=nrcs142p2_054280
- Mangrove forests: One of the World's threatened major tropical environments at least 35% of the area of mangrove forests has been lost in the past two decades, losses that exceed those for tropical rain forests and coral reefs, two other well-known threatened environments.Bioscience51(10):807‑815.
- The accounting push and the policy pull: balancing environment and economic decisions.Ecological Economics124:145‑152. https://doi.org/10.1016/j.ecolecon.2016.01.021
Supplementary material
“Expert judgement” for the purposes of this paper refers to the informed opinions of individuals with particular expertise.
The main ecosystem services classification includes 24 services. Another 13 are mentioned in the individual chapters. Four services were mentioned, but not assessed in the report (ornamental resources, air quality regulation, social relations and sense of place).
Although FEGS-CS is a classification system, it also provides an assessment of the links between ecosystem types and ecosystem services. CICES is also a classification system, but does not provide an assessment of the links between ecosystem types and ecosystem services. Therefore, CICES is not considered as an “input study” for this analysis. For a detailed concordance between FEGS-CS and CICES, see
As a member of the working group, the first author contributed substantially to the resulting classification system.
To facilitate interpretation, category names used in the supersets are shown in boldface. Categories used in the input studies are enclosed in quotes.
FEGS-CS is discussed earlier as a contributing input study since it links ecosystem services with environmental sub-classes.
CICES has been updated to version 5.1 (
“Swamps and floodplains” averaged only $47 per hectare for “Food production”.
Since the original research on this article, CICES V5.1 has incorporated some of these recommendations. The first author had shared some of the recommendations with the authors of CICES in preparation of the FEGS/CICES correspondence background paper (
At Consensus Level 3, there is agreement on over half the ecosystem/ecosystem service linkages (1,284 out of 2,304). Given that this demonstrated agreement amongst only three of the nine input studies, it could not be considered consensus. At Consensus Level 5, there is agreement on only about one-quarter of the linkages (581 out of 2,304). At Consensus Level 5, the resulting summary (Fig. 2) would not have been sufficiently informative as a checklist for ecosystem service studies.