|
One Ecosystem :
Research Article
|
|
Corresponding author: Fernando Santos-Martin (fernando.santos@urjc.es), Arto Viinikka (arto.viinikka@ymparisto.fi), Laura Mononen (laura.mononen@ymparisto.fi), Luke M Brander (lukebrander@gmail.com), Petteri Vihervaara (petteri.vihervaara@ymparisto.fi), Inge Liekens (inge.liekens@vito.be), Marion Potschin-Young (marion.potschin@fabisconsulting.com)
Academic editor: Benjamin Burkhard
Received: 16 May 2018 | Accepted: 03 Jul 2018 | Published: 12 Jul 2018
© 2018 Fernando Santos-Martin, Arto Viinikka, Laura Mononen, Luke Brander, Petteri Vihervaara, Inge Liekens, Marion Potschin-Young
This is an open access article distributed under the terms of the Creative Commons Attribution License (CC BY 4.0), which permits unrestricted use, distribution, and reproduction in any medium, provided the original author and source are credited.
Citation:
Santos-Martin F, Viinikka A, Mononen L, Brander L, Vihervaara P, Liekens I, Potschin-Young M (2018) Creating an operational database for Ecosystems Services Mapping and Assessment Methods. One Ecosystem 3: e26719. https://doi.org/10.3897/oneeco.3.e26719
|
|
Abstract
Identifying and applying the appropriate method for ecosystem services mapping and assessment is not trivial. To provide guidance in this task, this paper describes the creation of a database for existing studies on mapping and assessing ecosystems and their services, which records relevant information to the ecosystem studies (e.g. methods used, the scale, ecosystem type, ecosystem service categories) and other relevant attributes that need to be considered. This database, therefore, forms the basis for an online ecosystem service ‘methods finder’. Our results provide an overview of the database itself (883 entries until April 2018) and the consultation within the ESMERALDA consortium that shaped its development, as well as providing an overview of the final mapping and assessment methods describing their spatial distribution. This work helps identify the main gaps and opportunities for alignment and development of commonalities in analytical approach amongst the individual Member States. The results illustrate the different conditions, dimensions and geographical contexts in Europe, information that can be used as background to help the development of a flexible methodology for mapping and assessing ecosystem services in Europe. The paper concludes with a discussion on how the typology of methods can be used in initiatives that aim to integrate ecosystems and their services in decision-making and planning. This work highlights some challenges for future activities on mapping and assessment of ecosystem services in the EU.
Keywords
Methods classification, ecosystem services, biophysical, social, economic, Europe
Introduction
Mapping and assessing ecosystems and their services (ES) is core to the EU Biodiversity (BD) Strategy 2020 (
In response to these requirements, ESMERALDA (Enhancing ecoSysteM sERvices mApping for poLicy and Decision mAking) aims to deliver a flexible methodology to provide the building blocks for pan-European and regional assessment. The work supports the timely delivery of EU Member States in relation to Action 5 of the BD Strategy and the needs of assessments in relation to the requirements for planning, agriculture, climate, water and nature policy. While other overviews of ecosystem services methods classification exist (
Methods
Step 1. Database consultation and development process
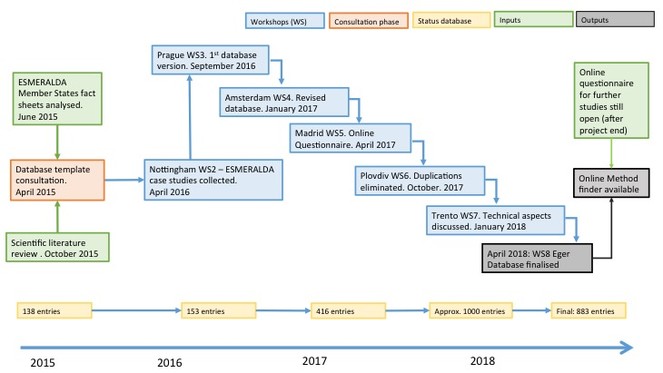
The development of the database (finalised in April 2018) is a result of a long consultation process within the ESMERALDA consortium (Fig.
Step 2. Collecting data
The development of the ESMERALDA database began in 2015 with the analysis of fact sheets from Member States (
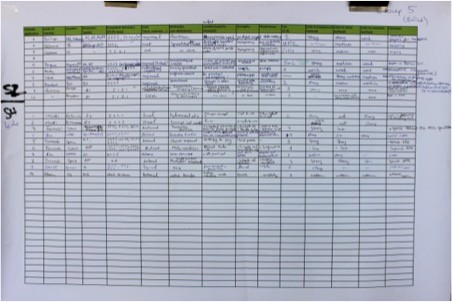
The development and collection of case studies from both scientific and grey literature took place in parallel. Both activities had slightly different aims and, as a result, the recorded attributes for the planned merged database needed to be harmonised. During the merging exercise, it became clear that a few headings were inconsistent. This resulted in a new consultation with the whole consortium and a ‘clean’ excel spreadsheet with 413 entries. On the basis of the updated template, a call for more examples was made during workshop No. 5 in Madrid (April 2017). For this call, an updated Guideline Document (
Step 3. Creating the database
During the third workshop in Prague (September 2016), the first version of the database was presented (Fig.
Step 4. Harmonisation and validation of data
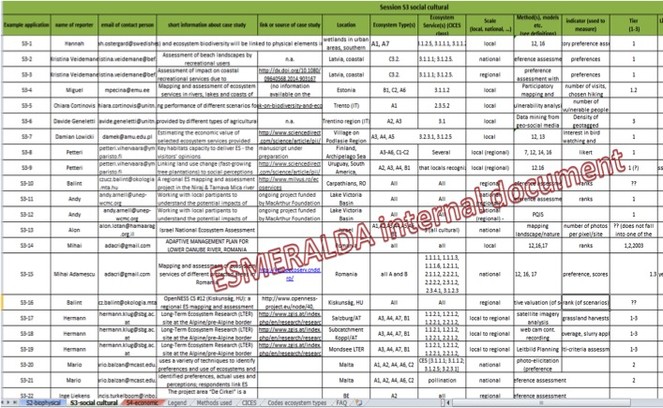
An online consultation*
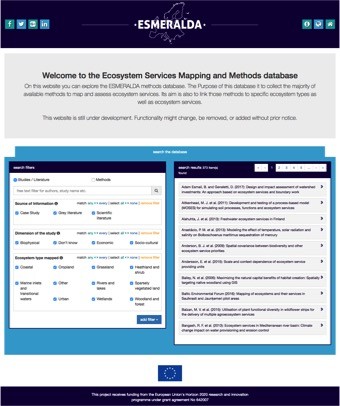
The next step in the database development was to clean the entries (by harmonising the author name spellings, links working, coding correct and updated etc.). Through several consultations, technical issues were clarified and the database changed accordingly. At the end of the project (July 2018), the ESMERALDA database contained 883 entries, identifying methods for mapping and assessing ecosystems and their services and the context in which they were used. It needs to be noted that one entry in the database represents a single method described in its context. If a case study (or publication) described a set of methods, each method was captured in a single entry. As a result, the total number of scientific studies was 370 which gave rise to the identification of 883 methods. This is taken into account in the results section of this paper and statistics referring to the methods refer to the 883 entries while others use the 370 individual studies. This was a technical necessity for the online method finder which required the facility for filtering according to specific information needs.
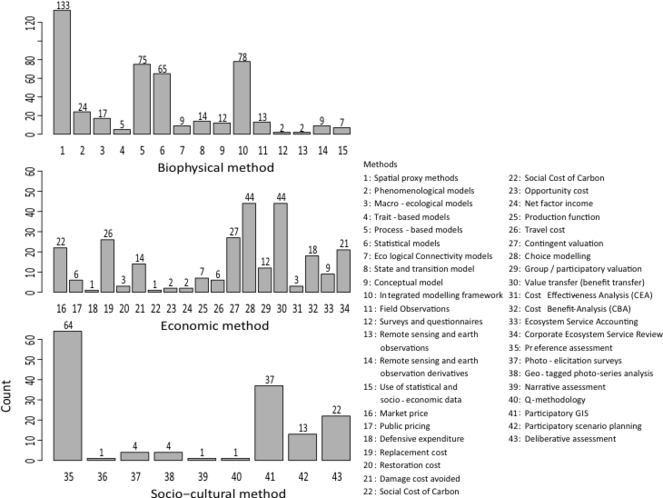
Step 5. Final methods identification and classification
The database developed over the course of three years, as did the final classification of methods. The original list of 37 methods was identified and presented as a draft ‘methods compendium for the Nottingham workshop (Fig.
Overview of the ecosystem service mapping and assessment methods proposed in ESMERALDA.
|
Method type |
Method number |
Method name |
|
Biophysical |
1 |
Spatial proxy methods |
|
2 |
Phenomenological models |
|
|
3 |
Macro-ecological models (includes habitat models) |
|
|
4 |
Trait-based models |
|
|
5 |
Process-based models (includes: landscape function models) |
|
|
6 |
Statistical models |
|
|
7 |
Ecological Connectivity models |
|
|
8 |
State and transition model |
|
|
9 |
Conceptual model |
|
|
10 |
Integrated modelling framework |
|
|
11 |
Field Observations |
|
|
12 |
Surveys and questionnaires |
|
|
13 |
Remote sensing and earth observations |
|
|
14 |
Remote sensing and earth observation derivatives |
|
|
15 |
Use of statistical and socio-economic data |
|
|
Economic |
16 |
Market price |
|
17 |
Public pricing |
|
|
18 |
Defensive expenditure |
|
|
19 |
Replacement cost (alternative cost method) |
|
|
20 |
Restoration cost |
|
|
21 |
Damage cost avoided |
|
|
22 |
Social Cost of Carbon |
|
|
23 |
Opportunity cost |
|
|
24 |
Net factor income (residual value method) |
|
|
25 |
Production function |
|
|
26 |
Hedonic pricing |
|
|
29 |
Travel cost |
|
|
30 |
Contingent valuation |
|
|
31 |
Choice modelling (choice experiment, discrete choice modelling) |
|
|
32 |
Group / participatory valuation |
|
|
33 |
Input-Output analysis |
|
|
34 |
Value transfer (benefit transfer) |
|
|
35 |
Cost-Effectiveness Analysis (CEA) |
|
|
36 |
Cost-Benefit Analysis (CBA) |
|
|
37 |
Ecosystem service assessment |
|
|
38 |
Ecosystem Service Accounting |
|
|
39 |
Corporate Ecosystem Service Review |
|
|
Socio-cultural |
40 |
Preference assessment |
|
41 |
Time-use assessment |
|
|
42 |
Photo-elicitation surveys |
|
|
43 |
Geo-tagged photo-series analysis |
|
|
44 |
Ecosystem service card game |
|
|
45 |
Narrative assessment |
|
|
46 |
Q-methodology |
|
|
47 |
Participatory GIS |
|
|
48 |
Participatory scenario planning |
|
|
49 |
Deliberative assessment |
Step 6. Output
A final presentation of the database took place during the workshop in Trento (WS no. 7) and the material was then passed on to the developers of the online method finder tool (Fig.
Results and applications
Geographical distribution and ecosystem types
Altogether, 28 countries within Europe were part of the database (this included 2 Baltic and 2 western Balkan countries, linked via regional hubs). The analysis indicated that ES mapping and assessments have been conducted in 26 countries (Fig.
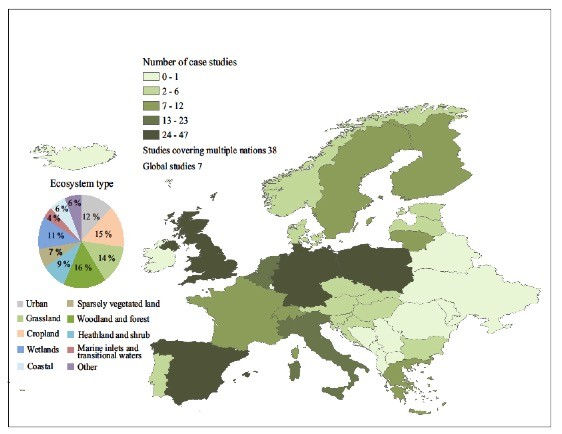
The examples included in the database cover all ecosystem types as indentified in MAES (
Of the 370 studies included in the database, 351 were written in English. However, we also encouraged national studies and hence the remaining 19 are written in Dutch (6), Polish (4), Slovenian (3), Hebrew (3), Swedish (2) and French (1). Most have an English abstract. We wanted to leave the opportunity open for national case studies to also be available for EU members states and the national MAES project. The variation in the language, however, does not reflect any bias but only reflects the background of the consortium members whohave submitted material.
Spatial Scales and sources of data
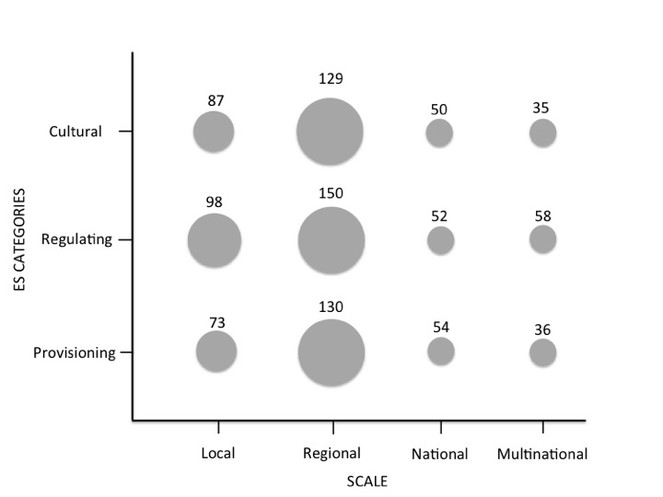
Most of the method applications (91%) focused on one scale in their study only, while 9% studies covered multiple scales. In total, the ‘Regional scale’ (43%) was the most commonly used (Fig.
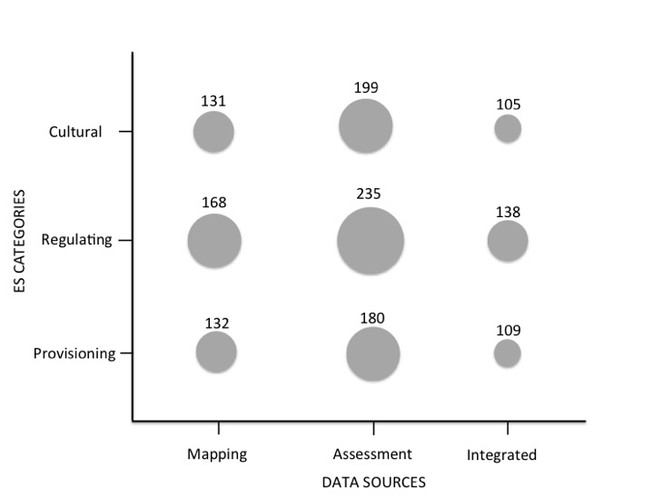
Regarding the nature of studies, 44% were classified as assessment, while 31% were purely focused on mapping. 'Mapping' stands for the spatial delineation of ecosystems as well as the quantification of their condition and the services they supply, while 'assessing' refers to the translation of scientific evidence into information that is understandable for policy and decision-making. Based on these definitions, 25% of the studies used a combination of mapping and assessment methods (Fig.
The majority of sources of the database come from published scientific papers (292), 41 came from grey literature (reports) and 37 from case studies. It should be noted that, if a case study was written up as a scientific paper, it was coded as ‘scientific literature’ and, if it was available as a report on a website, then it was coded as ‘grey literature’. Hence, the coding followed the easiest access to the information and so avoided double counting.
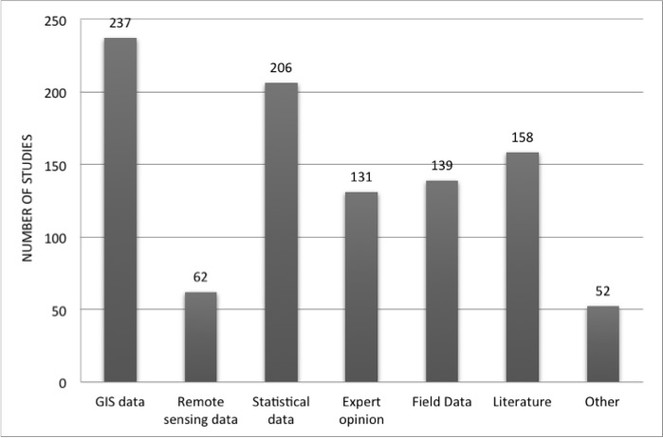
Responders to the online questionnaire were also asked which data were used and how these data are available. In most examples, GIS data formed the basis for the investigation, followed by statistical data (Fig.
Mapping and assessment methods and ES classification systems
When looking at the ‘Domains of the method’, studies were classified into ‘biophysical’*
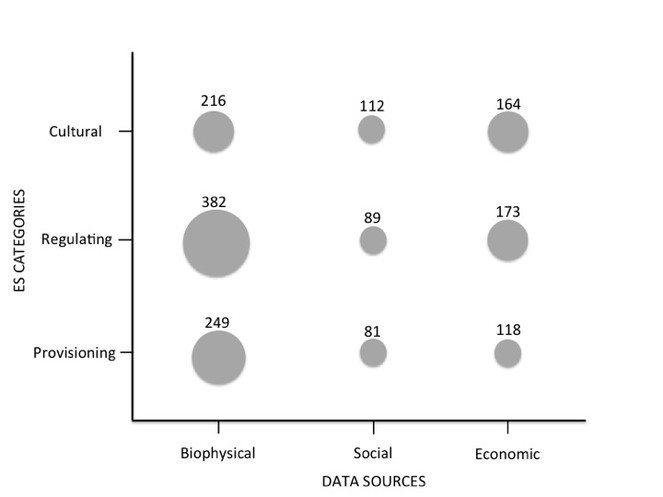
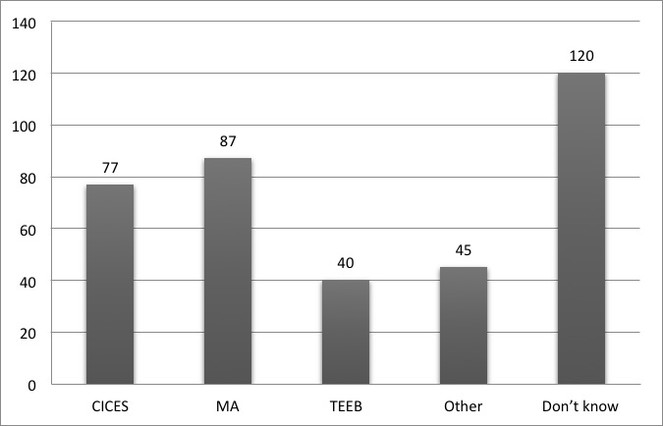
Another question and requirement to describe the entry was ‘which ecosystem service classification system’ was used? While the adopted framework was described in MAES and in ESMERALDA CICES version 4.3. , we did not want to exclude valid information that used methods linked to different classification systems. As Figure 10 shows, a slight majority of entries is based on the MA classification, followed by CICES (77) and TEEB (40). While 40 used a different or slightly adjusted system, in 120 cases, no information was provided on the system usedor they simply did not know (hence it was not possible for the transcriber of the study to answer this question).
The transcribers were asked to identify which of the CICES classes (version 4.3,
We also asked if the method described was used for the demand or supply side of the ecosystem service investigation; 433 examples link a method to the supply side, 303 examples reflected on both – the supply and demand side - whereas so far only 83 described the demand (or actual use) of the ecosystem services. This again might simply be a reflection of development in the ecosystem service research and its available publication. The studies of the earlier years all concentrated on the supply side, where more recent work tended to look at the demand side.
Policy and business applications
As the aim of ESMERALDA is to support the MAES initiative, we were also interested to see if studies considered questions relevant to the policy and business sectors (Fig.
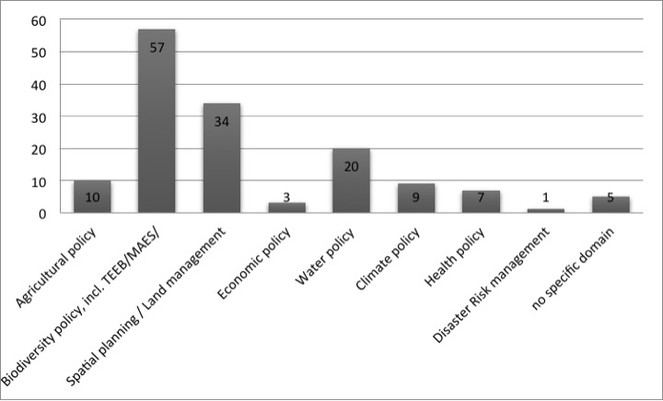
Based on the questions in the database and the questions collected within ESMERALDA and the MAES process, we made a classification to enable users to easily find relevant information for different policy questions (
Policy and business objectives described in the database linked with the mapping and assessment methods.
|
Policy Domains |
Policy objective |
Business objective |
|
1. Agricultural policy |
1. Awareness raising |
1. Site management (achieve and promote biodiversity-friendly management of corporate sites) |
|
2. Biodiversity policy |
2. Benchmarking and prioritisation (performance indicators to monitor evolution / benchmark/ identify priority areas) |
2. Operational management (reduce costs and risks of interruption, realise efficiency gains) |
|
3. Spatial planning / Land management |
3. Policy evaluation (evaluating the impact of policies, policy actions) |
3. Legal and regulatory issues (identify future legislation, reduce compliance costs and risk of fines) |
|
4. Economic policy |
4. Project evaluation (evaluating the impact of individual projects on ecosystem services) |
4. Financing (reduce financing costs and increase margins, improve access to finance-attract investors) |
|
5. Water policy |
5. Accounting (measure the changes in the stock of natural capital and integrate the value of ecosystem services into accounting and reporting systems) |
5. Reputational and marketing (identify revenue streams, differentiate products, improve ability to attract and retain employees) |
|
6. Climate policy |
6. Instrument design (design incentives, targeting user groups) |
6. Societal (identify benefits and negative impacts to local communities, support social licence to operate) |
|
7. Health policy |
7. Litigation (damage and compensation claims, liability issues) |
7. Other |
|
8. Disaster Risk management |
8. Preference assessments |
|
|
9. No specific domain |
9. Other |
Discussion and recomendations
The development of the database on ecosystem service mapping and assessment applications was a key element running through the entire lifetime of the ESMERALDA project, including all workshops. The process of developing the database created much debate and forced us to be clear about terminology which helped expand the project glossary (
One aspect to be noted is that, although the database reflects what has been done in the ecosystem service community, it does not include any prioritisation nor recommendations. While a method may have been used many times to analyse a certain issue, no expert opinion is included in the database to help the user decide if this is right or wrong. The number times a method was used does not reflect any indication that it is best; it is just a matter of how many people wrote about it. It is also important to note that entries can reflect ideas that are currently in fashion. For example, although participatory GIS was in vogue for a while, this does not mean that this is the perfect method or that others could not be used to establish a value for a service or to aid prioritisation.
As usual with the creation of reviews such as these, a common understanding of the information asked is needed to avoid different answers to the same question. This was done here through several quality assurance methods within the consortium. However, it needs to be noted that, so far, the database is an ESMERALDA internal product and its usefulness has yet to be reviewed outside the consortium.
Based on the work described here, the following can be concluded:
- A detailed list of methods that have been used in different studies in Europe can help in the implementation of Action 5 of the EU Biodiversity Strategy.
- Methods need to be classified in relation to a set of individual variables (i.e. study dimension, scales, ecosystems or ecosystem services) in order to be appliedto other applications.
- It is important to identify how methods are being used in scientific and policy environments in order to help identify knowledge gaps and provide guidance.
- The presentation of these results provides a base line for Member States to stimulate the process of developing the flexible methodology for mapping and assessment activities.
- One advantage of this practical classification of methods is that it shows that it is possible to capture the different perceptions of ecosystems and their services, according to specific use or non-use of that ecosystem/service. However, as this brings also a level of complexity, a practical guide for selecting methods according to the resources is therefore required.
Acknowledgements
The authors wish to thank the whole ESMERALDA consortium for their discussion and inputs during workshop in creating the structure and their entries into the database. Special thanks to the additional ESMERALDA Executive Board members for intense debate on structure, expected outcomes etc. Entries are acknowledged in the database through their citation.
Funding program
This is a product of the H2020 project ESMERALDA and the entire work was funded under EU H2020 research and Innovation programme under grant agreement No. 642007.
References
- An operational framework for integrated Mapping and Assessment of Ecosystems and their Services (MAES).One Ecosystem3:e22831. https://doi.org/10.3897/oneeco.3.e22831
- ESMERALDA (2017) Method Database guidelines EU Horizon 2020 ESMERALDA Project, Grant agreement. In: Potschin M, Brander LM, Nedkov S, Vihervaara P, Viinikka A, Santos-Martin F (Eds) ESMERALDA.642007. URL: http://www.esmeralda-project.eu/documents/5
- Haines-Young R, Potschin M (2013) CICES V4.3 - Report prepared following consultation on CICES Version EEA Framework Contract No. EEA. URL: https://unstats.un.org/unsd/envaccounting/seeaRev/GCComments/CICES_Report.pdf
- Haines-Young R, Potschin MB (2018) Common International Classification of Ecosystem Services (CICES) V5.1 and Guidance on the Application of the Revised Structure. CICES. URL: www.CICES.EU
- Selecting methods for ecosystem service assessment: A decision tree approach.Ecosystem Services29:481‑498. https://doi.org/10.1016/j.ecoser.2017.09.016
- Kopperoinen L, Varumo L, Maes J (2018) Final stocktaking of EU member state needs Deliverable 2.3 EU Horizon 2020 ESMERALDA Project, Grant agreement. ESMERALDA.642007. URL: http://www.esmeralda-project.eu/documents/1/
- Mapping and Assessment of Ecosystems and their Services. Indicators for ecosystem assessments under action 5 of the EU biodiversity strategy to 2020.Publications office of the European Union, Luxembourg[ISBN978-92-79-36161-6] https://doi.org/10.2779/75203
- An indicator framework for assessing ecosystem services in support of the EU Biodiversity Strategy to 2020.Ecosystem Services17:14‑23. https://doi.org/10.1016/j.ecoser.2015.10.023
- Maes J, Liekens I, Brown C (2018) Which questions drive the mapping and assessment of ecosystems and their services under Action 5 of the EU Biodiversity Strategy? One Ecosystem (in press).
- Potschin-Young M, Burkhard B, Czúcz B, Martín FS (2018) Glossary for Ecosystem Service mapping and assessment terminology Deliverable D1.4 EU Horizon 2020 ESMERALDA Project, Grant agreement. ESMERALDA.642007. URL: http://www.esmeralda-project.eu/documents/5
The online consultation is available at: https://www.webropolsurveys.com/S/85E71B9D58A30304.par
Biophysical = An assessment of the biological and physical element s of an ecosystem, including geology, topography, hydrology and soils.
Social = Different methods that analyse human preferences (as well as people’s cognitive, emotional, ethical responses to nature) towards ecosystem services in non-monetary term
Economic = The process of expressing a value for a particular service in a certain context (e.g. of decision-making) in monetary terms.