|
One Ecosystem :
Case Study
|
|
Corresponding author: Stoyan Nedkov (snedkov@abv.bg)
Academic editor: Davide Geneletti
Received: 02 Apr 2018 | Accepted: 31 May 2018 | Published: 11 Jun 2018
© 2018 Stoyan Nedkov, Bilyana Borisova, Boian Koulov, Miglena Zhiyanski, Svetla Bratanova-Doncheva, Mariyana Nikolova, Julia Kroumova
This is an open access article distributed under the terms of the Creative Commons Attribution License (CC BY 4.0), which permits unrestricted use, distribution, and reproduction in any medium, provided the original author and source are credited.
Citation:
Nedkov S, Borisova B, Koulov B, Zhiyanski M, Bratanova-Doncheva S, Nikolova M, Kroumova J (2018) Towards integrated mapping and assessment of ecosystems and their services in Bulgaria: The Central Balkan case study. One Ecosystem 3: e25428. https://doi.org/10.3897/oneeco.3.e25428
|
|
Abstract
The aim of the EU Biodiversity Strategy to 2020 isto maintain and enhance ecosystem services (ES) in Europe and requires all Member States to map and assess the state of ecosystems and their services in the respective national territories. The EU-funded project ESMERALDA analyses ES mapping and assessment methods and approaches in their biophysical, social and economical perspectives, as well as their application in different case studies. The project also aims at the development of an integrated and consistent assessment framework. In Bulgaria, methodological guides for evaluation and mapping of the services provided by the nine main types of ecosystems have been prepared together with the respective proposals for their implementation in the national assessment. The Bulgarian research team analyses and tests various aspects of ecosystem services mapping and assessment, such as alternative economic assessments, multi-criteria analyses and biophysical assessment approaches, mapping challenges and local population surveys. In this paper paper, we review the ES activities in Bulgaria and present selected mapping and assessment methods tested in the Central Balkan case study area. It provides relevant examples for the implementation of integrated mapping and assessment of ecosystem services at local and regional level, where different mapping approaches and techniques are embedded within diverse policy contexts. The main goal of the study is to investigate how the assessment results can support the integration of the ecological functions of the Central Balkan National Park with the economic opportunities that it creates for the local and regional communities. A tiered approach has been used to organise the mapping and assessment exercises in the study area, in order to meet the needs for integrated ecosystem assessment and overcome the limitations of data availability. At tier 1, the study performs identification and initial ES mapping of the whole area. At tier 2, it applies economic valuation for the Municipality of Karlovo by using statistical data and the contingent valuation method. At tier 3, the investigation applies modelling methods to assess carbon storage and flood regulation on a larger scale. The results are presented in the form of maps at all levels, which use a uniform 0 to 5 assessment scale. The integrated approach presented here ensures a clear communication of the end results to the respective decision-makers.
Keywords
Integrated assessment, economic valuation, flood regulation, carbon storage, ecosystem services dysergy, Karlovo Municipality, national park, biosphere reserve
Introduction
The natural world, its biodiversity and its constituent ecosystems are critically important to human well-being and economic prosperity, but are consistently undervalued in conventional economic analyses and decision-making (
Bulgaria has been carrying out a wide range of research which analyses various aspects of the Natural Capital concept and its derivative - Ecosystem Services. Investigations include pilot alternative economic assessments (
The Central Balkan National Park, together with municipalities at its boundaries, have been test sites for ES mapping and assessment activities carried out under the framework of several research projects at the national, regional and local scale (
In view of the above, the main objectives of this paper are:
- to make a review of the ES mapping and assessment activities in Bulgaria in relation to the MAES process and select appropriate methods and approaches for the ES mapping and assessment within the boundaries of the case study area;
- to present the selected mapping and assessment methods used at the different scales and tiers;
- to discuss the applicability of the selected methods in the context of integrated ecosystem assessment.
Mapping and assessment of ecosystem services in Bulgaria
Review of ES mapping and assessment studies in Bulgaria
We collected all available mapping and assessment studies published in scientific journals, grey literature and project reports. They were analysed according to several criteria including geographical scope, ecosystems services which were mapped and assessed, applied methods, scale, tier and purpose of the study (see Suppl. material
The studies cover various topics including multi-criteria analyses and biophysical assessment approaches (
Several targeted areas test the practical application of a GIS-based mapping, assessment and valuation of ecosystem services model in real world administrative territorial units at the local level in Bulgaria (
The same study emphasises the importance of active and continuous two-way communication with public leaders in all spheres and government levels, a “critical mass” of the socially active population plus an ever open group of stakeholders. These groups should be necessarily and sufficiently convinced that the utilisation ESS concept will not just suit the local geographic conditions, but also provide the locality with certain comparative advantages with clearly identifiable benefits for the wellbeing of the majority or important section of the population, e.g. young people. Such advantages are expected to represent a significant step towards balanced and sustainable governance of the respective administrative unit. In the same context,
The literature review shows that several studies use the benefits of natural units/geosystems, as a carrier of information on ecosystem services assessment (
Methodological framework for mapping and assessment of ecosystems and their services in Bulgaria
Ecosystems are mapped by building up a series of overlays of significant factors, such as the distribution of different communities of organisms, the biophysical environment (soil types, drainage basins, depth of water bodies) and spatial interactions (e.g. migration patterns). Ecosystem boundaries are likely to coincide with discontinuities in these factors. Thus, ecosystems within each category share a suite of climatic, geophysical and biochemical conditions, biological conditions (including species composition and interactions) and socio-economic factors shaping land cover (e.g. dominant uses by humans, which tend to differ across ecosystems).
In Bulgaria, the ecosystems mapping and assessment process has been performed following the National Methodological Framework. The methodologies are in line with the analytical framework proposed by the European Commission (
The general scheme of the assessment and mapping process is presented in Fig.
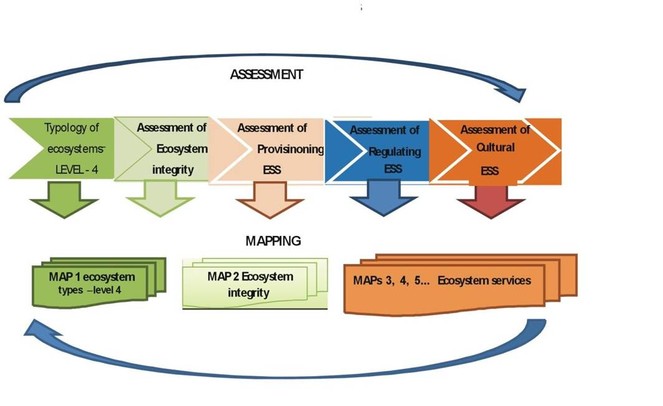
1. The first phase is to identify and map the existing ecosystem types in the given area.
The 5 steps of elaborating the ecosystem typology in Bulgaria include:
Step 1 – Identification of the ecosystem type - levels 1 and 2 MAES
Step 2 – Identification of the ecosystem levels 3 and 4 of the given type
Step 3 – Collection of data (national data sets)
Step 4 – Identification of the gaps in data and areas with data uncertainty
Step 5 – Mapping (Production of maps of ecosystem types) and monitoring of trends.
2. The Second phase involves assessment and mapping the ecosystem integrity and condition.
The overarching concept of the ecosystem condition assessment in Bulgaria is the concept of ecosystem integrity, described in
In order to assess the condition of the ecosystems in Bulgaria, scores are assigned (from 1 to 5) depending on the measured/assessed values of every indicator (by expert evaluation made during the preparation of Part B methodologies and applied during the mapping for each specific polygon), thus reflecting the “condition” of the process or the structural element of the ecosystem for which the indicator is relevant. The scores correspond to the scale from 1 (bad condition) to 5 (very good condition). In order to collate all separate indicator scores into one single measure of ecosystem structural-functional condition, we introduced an Index of Performance (IP) for a particular ecosystem. The IP is calculated as the ratio of the sum of the indicator scores to the maximum possible indicator sum.
3. The third phase includes assessment, mapping and monitoring of ecosystem services
The current methodology and other relevant parts of the National Methodological Framework contribute to the practical implementation of the ecosystem approach in the assessment of ecosystem services on a national scale, as follows:
Step 1: List, using the CICES classification (
Step 2: List the components of the ecosystem or ecosystem mosaics that supply each service or service bundle, relevant to the respective landscape and purpose. Ecosystem components can include particular species, habitats, communities or functional groups (such as ‘large trees’ or ‘pollinators’).
Step 3: Identify those components that make the greatest contribution to the service supply (i.e. the critical ecosystem components). For some services, there may be critical ecosystem components that are common across a range of ecosystem types.
Step 4: Establish the relationship between the condition (state) of the critical ecosystem components and the supply of the service, which is important in selecting the indicators used to assess the condition on the basis of data from statistics, environmental monitoring or reporting under EU environmental legislation. The establishment of the ecosystem condition–service supply relationship is more important when there are several critical ecosystem components involved in the supply of a given service, as aggregating their condition into one ‘service supply’ is not necessarily a case of simply adding them together.
Step 5 is divided into two parts:
Step 5a involves the assessment of the baseline condition of the critical ecosystem components (i.e. ecosystem service supply) using the indicators from relevant EU environmental directives. The ‘status’ assessments of these indicators are used to evaluate the ability of the critical ecosystem components to supply the ecosystem service of interest, in terms of whether the indicators ‘pass’ or ‘fail’ in meeting the objectives of the relevant directive (e.g. favourable conservation status). This would mean that the critical ecosystem component is in ‘good’ or ‘bad’ condition, respectively and reflects its ability to supply the service of interest.
Step 5b uses information on the pressures acting on the ecosystems, the trends in those pressures and the link between pressures and condition to establish the potential impacts on the supply of the ecosystem service over time, at least qualitatively.
Step 6: Combining the above two steps (Steps 5a and b) and aggregating all the critical ecosystem components along the state–service relationship (from step 4) would result in an assessment of the ability of the ecosystem to supply the service, also considering the DPSIR (Drivers, Pressures, State, Impact, Response) framework.
The final step includes the assignment of scores (by expert assessment) indicating the capacity of the given ecosystem to deliver a particular service – scores from 1 (very low capacity) to 5 (very high capacity) (
Integrated ES assessment in the Central Balkan: Approaches and methods
Mapping and assessment of ES, as defined in the Biodiversity strategy to 2020, is a comprehensive process that builds on various individual tasks and their systematic integration. Therefore, an integrated and operational framework is needed to support and coordinate these activities (
Research and policy issues
Case study area
The case study area is located in Central Bulgaria and covers the central part of the Balkan Mountains (Stara Planina in Bulgarian) and the surrounding areas (Fig.
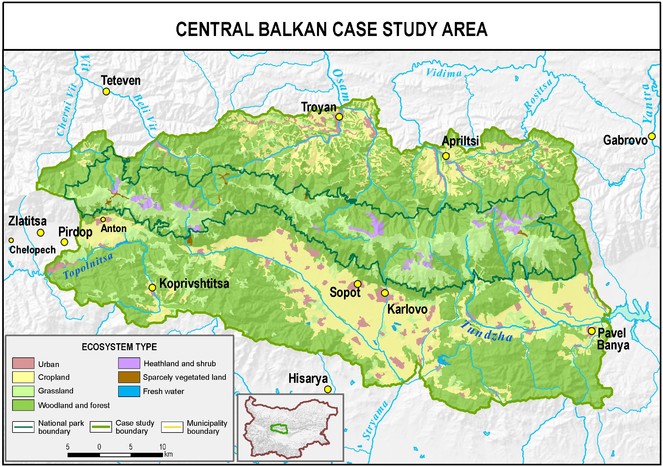
The study area covers partially the territory of the following nine municipalities – Teteven, Anton, Pirdop, Karlovo, Sopot, Sevlievo, Apriltsi, Troyan and Pavel Banya. Only two of them - Karlovo (103911 ha) and Sopot (5630 ha) are situated entirely within the case study area. There are 82 settlements with a total population of 128626 residents while 58% of the population (74205 inhabitants) lives in urban areas. The most populated towns are Karlovo (25715 inhabitants) and Troyan (23623 inhabitants). The population of Karlovo Municipality is estimated at 50650 residents with a decreasing trend, due to the negative growth rate.
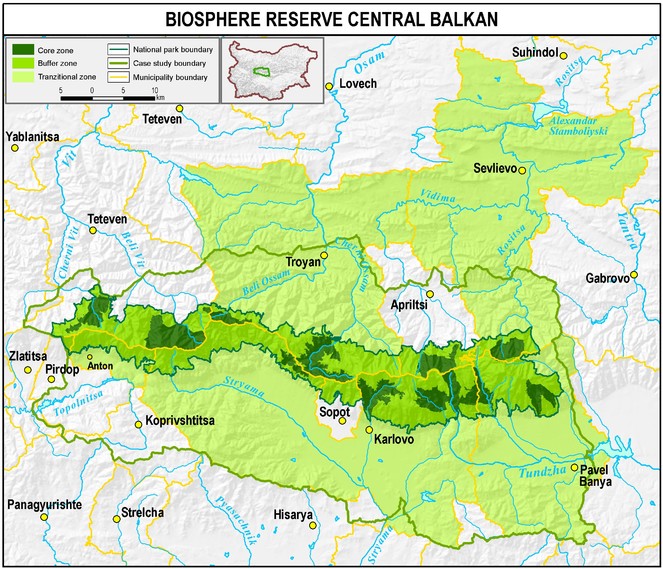
The Central Balkan National Park occupies the higher parts of the mountain and varies in altitude from 550 m to 2376 m. The park is part of the PAN Parks network and is one of the largest and the most valuable protected areas in Europe, ranked at category 2 by IUCN. It performs the functions of a significant ecological corridor in Eastern Europe, as well as a nexus for genetic exchange between the southern Balkans and the Asia Minor Peninsula. The Central Balkan National Park belongs to the Rhodope montane mixed forests terrestrial ecoregion of the Palearctic temperate broadleaf and mixed forest and is home of rare and endangered wildlife species and communities. The flora is represented by 2340 species and subspecies of plants. Forests occupy 56% of the total area. There are 59 species of mammals, 224 species of birds, 14 species of reptiles, 8 species of amphibian and 6 species of fish, as well as 2387 species of invertebrates. The National Park includes nine nature reserves that cover 28% of its territory. Since 2017, the Central Balkan National Park has formed the core and the buffer zone of the new Central Balkan Biosphere Reserve (Fig.
The studies in the area of Central Balkan include flood hazard assessment and mapping of flood regulation in the upper part of the Yantra basin, natural capital assessment and application of the contingent valuation method in the Apriltsi and Kalofer municipalities (
Policy context
The application of the Ecosystem Services (ES) concept to the Central Balkan case study facilitate the adoption and/or further establishment of a number of policy instruments for a science-based, sustainable territorial governance, amongst which: the need for regular monitoring, immediate, free and open access to data, information and know-how; integration of scientific knowledge in civic affairs governance practice; continuous planning process with in-built policy alternatives coupled with respective impact assessments; continuous education, proper motivation and constant involvement of the stakeholders and the public (
The overall territorial impact of the Central Balkan NP, category II in the IUCN classification, on the development of its region, however, still presents significant challenges to comprehensive assessment, due to a number of factors, amongst which the sheer number and the diverse and multi-scale character of the institutions and actors involved. The Park itself is managed by the 1998 Protected Territories Act (Suppl. 1, Art. 8.1, Amen. SG 28/2000, Amen. SG 77/2002) and administered by the Ministry of Environment and Waters and its National Nature Protection Service. The Service is responsible for development of protection and conservation strategies, programmes, plans and other regulatory documents. Thus, the direct impacts on the Park are strongly related to the implementation of the national conservation policy.
Simultaneously, Central Balkan is the second largest national park in Bulgaria and its territory is included in four NUTS 2 economic planning regions, five NUTS 3 administrative regions (oblast) and nine LAU 1 self-governing administrative regions (obshtina) with thirty settlements, including seven towns. Their strategic and short term planning and policy documentation does not always coincide in time period, territorial scope, quality or level of implementation. For example, most municipal development plans (Troyan, Karlovo, Sevlievo, Pavel Banya, Anton) provide a strategic framework and programme for their development for the 2014-2020 programming period, while the Pavel Banya Municipal Plan still refers to the previous 2007-2013 planning period. The comparative analysis of the basic local development planning instruments – the municipal development plans – shows generally weak intra-regional and inter-sectoral connection and even less cooperation. Overall, some of the plans’ objectives are nature conservation-orientated and focus on the preservation of natural resources and natural heritage. They espouse implementation of international conventions and national conservation guidelines, e.g. Natura 2000, CBD, UNESCO MaB Programme and Seville Strategy, National Priority Framework for Action in Natura 2000 Areas. However, the EU level, national and regional development documents all focus on the population settlements and, particularly, the urban centres and do not directly connect their wellbeing to the Central Balkan NP, which is the legal responsibility of other ministries and agencies.
The local economic policy context in the Central Balkan NP region almost uniformly promotes development of sustainable tourism and ecotourism, nature and cultural tourism IN particular, are viewed as the key potential. This and most other envisioned economic activities (e.g. measures to support the shift to organic farming, local livestock breeding and silvi-culture bio-products, sustainable energy production) indicate a strong thematic link to the eco-potential of the National Park. Municipal plans provide ample evidence that, at the expert level at least, an increasing understanding has been shaping for the need for valorisation of a number of concrete ecosystem services, including in the forestry and water sectors and natural hazards control (i.e. forest fires, soil erosion, avalanches, floods and climate regulation. The main challenge in terms of regional territorial strategies and policies is to successfully combine the protection of natural assets and landscapes with valuation of ecosystem services and sustainable development.
This review of the ES studies in the Central Balkan area gains further significance in light of the latest developments in its ecological status. As a result of the implementation of the Seville Strategy for Biosphere Reserves (
The geographic structure of the new Biosphere Reserve consists of three functional zones:
- a core area, which comprises the nine reserves of the existing Central Balkan National Park;
- a buffer zone, which includes the rest of the National Park’s territory; and
- a specially created "development zone", which encompasses 80% of the area of the "Central Balkan Biosphere Reserve" and acts as a transition area between the National Park as a whole and the ecologically unregulated parts of the local municipalities (Fig.
3 ).
The Biosphere Reserve’s development zone is made up of territories from the following municipalities: Karlovo, Troyan, Sevlievo, Pavel Banya and Anton. It is an area of geospatial integration of the ecological (conservation and protection) functions of the National Park with the economic opportunities that the Park creates for the population in the region, including particular types of tourism and recreation services and a number of forest- and mountain-related ES.
According to the Lima Action Plan (2016-2025), a key role for the efficiency of biosphere reserves is their recognition as a source of ecosystem services and the provision of a long-term vision for the protection of these services (
- Enlargement of the environmental information base and its decision-making support functions, which go beyond the Natural Resources concept;
- Deepening the role of the financial mechanisms in environmental policy and natural resources management;
- Raising the value of spatial and sectoral planning analyses and increasing their sensitivity to landscape versatility.
Comprehensive identification and consideration of the dependence of the local population on the ES in the nearby areas makes valuation of the ES an important factor in sustainable landscape planning and territorial integration policy-making (
The studies above target the area of the following Natura 2000 zones: "Central Balkan" BG0000494, "Central Balkan buffer" BG0001493 and BG0002128 and the municipalities of Karlovo and Troyan. A series of activities, related to schemes for payments for ES (restoration and maintenance of a locally characteristic gene pool in protected areas - rare local animal breeds), support for organic livestock breeding (in ecosystems of high conservation value), as well as co-financing of economic activities, where the revenues are used to protect biodiversity, have been formally approved within the scope of the territory under investigation. These activities are part of the successful project of six Bulgarian NGOs, four Swiss organisations and the Ministry of Agriculture, Foods and Forests through the Executive Agency for Selection and Reproduction in Animal Breeding, named "For the Balkans and the Humans" (2012-2016), that won an European Commission "NATURA 2000" award in the "Socio-Economic Benefits" category (
Data availability and application of a tiered approach
Mapping of ecosystems and their services depends to a very large extent on the availability of spatial data. The requirements to the data quantity and quality are strongly influenced by the scale of mapping. Larger scale mapping requires more detailed spatial data with higher accuracy. Some sources of data for the Central Balkan meet these requirements but none of them covers the whole study area. The data generated by the projects, which implemented the methodology for mapping and assessment, are organised in spatial datasets representing the ecosystems at the third level of the MAES typology. They correspond to scale 1:25000 and have aminimum mapping unit of 0.25 ha. There are actually nine different datasets, one for each main ecosystem type, which are not fully compatible. Furthermore, they do not cover the NATURA 2000 zones, which cover a significant part of the study area. More detailed datasets exist at municipality, city and watershed level which have been used for mapping and assessment of the selected ecosystem services. For instance, the results of the hydrologic modelling of the Vidima Watershed (
The CORINE land cover dataset is the only one available that covers the whole study area. While it is too coarse for municipality or city level mapping and assessment, it is sufficient for a general overview of the ecosystems in the area and identification of relevant ecosystem services. The tiered approach has been used to organise the mapping exercises in the study area, in order to meet the needs for integrated ecosystem assessment and overcome the limitations of data availability. At tier 1, the studies perform identification and initial ES mapping for the whole case study area using CORINE land cover data for ecosystems delineation and expert-based assessment of the ecosystem services. At tier 2, it applies economic valuation for the Municipality of Karlovo by using statistical data and the contingent valuation method. At tier 3, the investigation applies more complex modelling methods to assess two different ecosystem services on a larger scale. Quantification of carbon storage for the assessment of global climate regulation is applied in the Karlovo Town and assessment of flood regulation based on GIS-based hydrological modelling is applied in the Vidima Watershed.
The tiered approach applied at different scales in frames of one and the same territorial unit illustrate very well the spatial integration of the assessed ecosystem services at different scales using different methods (Table
Overview of mapping and assessment methods applied in the case study area at different tiers and scales.
|
Case study |
Scale |
Tier |
Ecosystem services |
Type of method |
Method |
|
Central Balkan |
Whole case study |
1 |
Bundle of relevant services |
Biophysical/ Social |
Spreadsheet |
|
Karlovo Municipality |
Municipality level |
2 |
Bundle of relevant services |
Economical |
Market price, Value transfer, Replacement cost, Net financial contribution (NFCu) |
|
Karlovo town |
Town level |
3 |
Global climate regulation |
Biophysical |
Spatial proxy model |
|
Vidima Watershed |
Watershed level |
3 |
Flood regulation |
Biophysical |
Process based modeling |
Mapping and assessment
Identification and initial ES mapping
The first step in the mapping and assessment procedure is to identify the ecosystem types and the relevant ecosystem services in the case study area. For this purpose, the studies use the spreadsheet method for ecosystem services assessment which is based on land cover/ES matrix approach (
Economic valuation at municipality level
Availability of data for the purposes of ES valuation at the municipal level is a problem significantly more serious than at the higher levels. National level statistics and Eurostat are better equipped with data for provisioning ES assessment; however, thematic limitations and information deficits do exist. Eurostat’s coverage of the local (LAU) scale is generally quite scant, so the demand is currently satisfied by data transfer methods which utilise the regional and national scales (
ES research in Bulgaria can partially rely on local business activity data, such as tangible fixed assets, number of active enterprises and short-term business initiatives, as well as inputs and outputs data. In some instances, data are obtained from the internal statistics of individual business entities, state institutions and associations or previously conducted research projects (as is the case with the Central Balkan National Park Directorate and the investigation of
The contingent valuation method, using a survey of 12 questions, has also been used in the Apriltsi Municipality and the Kalofer Mayorality. It is primarily orientated towards determining the local population’s knowledge, preferences and dependences regarding ecosystem services.
Database optimisation involves results obtained by assessment of the ecological status and, respectively, the potential of ecosystems to provide services. It is based on analysis of information from: the assessment of the state of the habitat types represented in NATURA 2000 protected sites within the CLC Classes at the respective municipality (with respect to the criteria: biodiversity, typology, natural character, rarity, size, vulnerability and stability/instability), validated by field observation data.
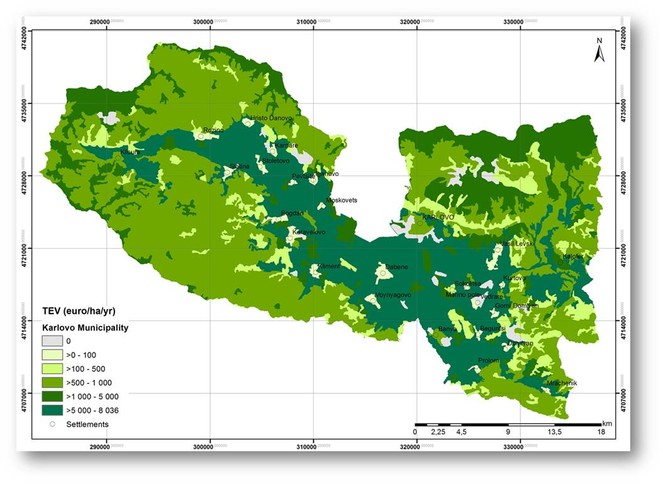
To summarise, the employed system of valuation methods, some of which are used indirectly, includes: Contingent Valuation, Market Price, Value Transfer, Replacement Cost and Net Financial Contribution (NFCu). The selection of concrete methods depends mostly on the possibility and practicality of transferring data or using generalisation methods, as well as the spatial variations of ES under evaluation. The total economic value (TEV, €/ha/yr) of the selected services, which form the current and future basis of the local economy and the welfare of the population, on the territory of the Karlovo Municipality (Koulov et al. 2017) is calculated as a sum (Formula 1 - Fig.

where: TEV is total economic value of ecosystem services; n=11 is the number of the raster layers; ESVj is the economic value of ES class type j; and m is the number of ecosystem services class types in layer i. The fact that the actual provision of one ES is dynamically linked to the provision of other services has been accounted for in the analytical process, which accompanies the valuation. Additionally, the study above ventures to analyse the impact of existing dysergies on the ES flows and attempts to incorporate their financial value. Thus, an intermediate step has been included, where necessary, in the course of the valuation, which assesses the complex and dynamic character of ecosystem interactions and their mutual interdependencies.
For mapping purposes, the investigations interpret the CORINE Land Cover 2012 classes (
Biophysical mapping at watershed and town level
Flood regulation mapping and assessment
Flood regulation has been assessed in the Vidima Watershed which is located in the northern part of the Central Balkan case study area. Vidima River is the left tributary of Rositsa River which is the main tributary of Yantra River (see Fig.
The approach relies on GIS based hydrological modelling performed through the extension ArcGIS AGWA2. It incorporates the KINEROS model, which is suitable for application in relatively small (up to 100 km2) watersheds with predominantly surface runoff. The model simulates water balance parameters within the watershed, which are used to quantify the regulation function for the different ecosystems. The outputs of the model used as indicators for flood regulation are infiltration, surface runoff and peak flow. The transformation of the model results to land cover classes has been carried out following the approach proposed by
Carbon storage mapping in urban ecosystems
Carbon storage is one of the most common indicators for assessing global climate regulation. It is defined as the amount of carbon stored in the vegetation and soil measured in tC/ha. For calculation and mapping of carbon storage of urban ecosystems in Bulgaria,
Integration and communication
The ecosystem assessment combines data and methods from various disciplines and the results could address different aspects of the ecosystem condition or ES delivery (in biophysical, social or economic terms). They have to be integrated in a proper manner in order to address the respective policy needs. In the context of MAES, the integration of results needs to combine the knowledge on ecosystem condition and ES to address key questions (
The integration of ecosystem condition and services is embedded in the methodological framework for mapping and assessment in Bulgaria, as both of them are assessed in the same relative scale. This allows convenient and easy interchange of data and results from different indicators of condition or services.
Results
Identification and mapping of ecosystems and their services
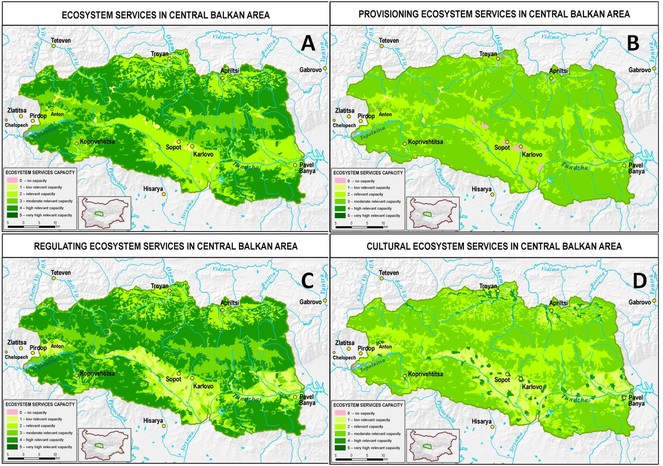
There are 20 ecosystem services identified as relevant for the selected case study area (Fig.
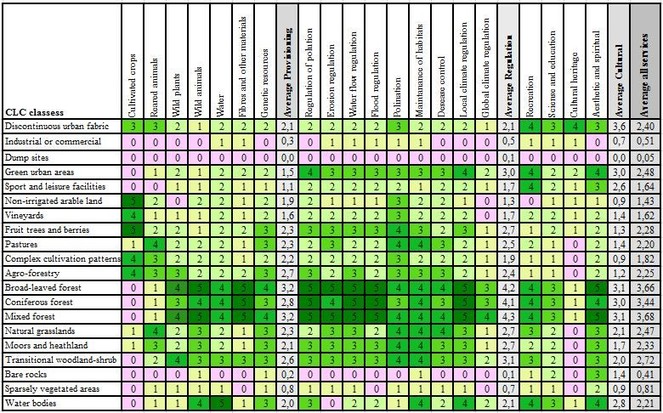
The results for regulating services are almost the same, while, for provisioning services the overall capacity of forests is similar to the other natural vegetation classes and close to the agricultural classes. The results for cultural services are slightly different, as the discontinuous urban fabric has the highest score. In general, both urban areas and forests exhibit similar (high) scores. All three forest types have very high supply capacity for regulation of pollution, water flow, flood regulation and provision of raw materials. Coniferous forests have a slightly lower score for erosion regulation, wild animals’ provision and aesthetic value. The main reason here is rooted in the coniferous forests in the area that are planted mostly outside their natural habitat. Pollination, maintenance of habitats and aesthetic value are the services with a higher average score, while cultural heritage is the service with the lowest average score.
The results of the expert-based assessment of the land cover classes have been transposed to ecosystems following the scheme, provided by
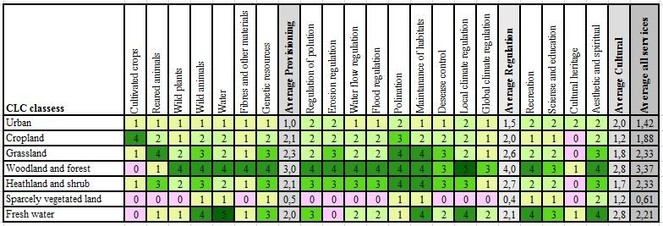
The results from the matrix, presented in Figure 4, have been summarised to prepare a map of the overall ecosystem services supply capacity (Fig.
Economic valuation of Karlovo Municipality
The ever-present question of geospatial boundaries within which to conduct any research study is especially pronounced in the case of the boundaries of particular ecosystems and the geographic limits of impact of the services they provide. In view of the main purpose of this research - decision-making support and facilitation of sustainable governance – administrative territorial boundaries are found most practical (
Based on Karlovo Municipality’s geography, the economic valuation of its ecosystems and their services (Koulov et al., 2017) involves five ecosystem classes (level 2 in
Based on the assessment of the local demographic, economic and ecosystems status, 11 classes (CICES 4.3) and 29 class types have been identified and selected as representative ES of the Municipality. The established key provisioning ES include Cultivated Crops, Reared Animals and their Outputs, Wild Plants, Algae and their Outputs and Surface Water for Drinking. The key regulation ES feature Mass Stabilisation and Control of Erosion Rates, Hydrological Cycle and Water Flow Maintenance and Global Climate Regulation by Reduction of Greenhouse Gas Concentrations. Finally, the selected cultural ES comprise Physical Use of Land-/Seascapes in Different Environmental Settings.
The TEV of the selected, currently utilised ES in the Municipality has been estimated at nearly €115 million. The most intensively used ecosystems for agricultural purposes at Karlovo Valley’s bottom are responsible for the majority of the ES production. Three ES - Cultivated Crops, Rearing Animals (a.k.a. animal husbandry) and Global Climate Regulation by Reduction of Greenhouse Gas Concentrations – hold the highest shares in the TEV structure. The Broad-leaved and Mixed Forests are most significant subclasses in terms of ES hotspots (Fig.
The critical analysis of the methods applied shows that the disproportion in data availability amongst provisioning, regulation and cultural ES often leads to an artificial increase in the Provisioning ES share in the structure of the TEV. On the other hand, the majority of data about regulation and cultural ES is more circumstantial and much less objective.
Biophysical mapping at watershed and town level
Flood regulation mapping in Vidima Watershed
The results of hydrological modelling have been used to estimate the flood regulation capacities of land cover classes, according to the following three indicators: infiltration, peak flow and surface runoff (Table
Ranges of the model result values for to estimate flood regulation ecosystem service supply capacity.
|
Capacity |
Infiltration (mm) |
Peak flow (mm) |
Surface runoff (mm) |
|
0 |
34.15 - 36.24 |
17.41 - 14.81 |
13.74 - 11.55 |
|
1 |
36.25 - 38.33 |
14.80 - 12.20 |
11.54 - 9.35 |
|
2 |
38.34 - 40.42 |
12.19`- 9.59 |
9.34 - 7.16 |
|
3 |
40.43 - 42.51 |
9.58 - 6.98 |
7.15 - 4.96 |
|
4 |
42.52 - 44.60 |
6.97 - 4.37 |
4.95 - 2.76 |
|
5 |
44.61 - 46.69 |
4.36 - 1.75 |
2.75 - 0.55 |
The capacity for flood regulation defined on the basis of modelling results has been calculated for the land cover classes in the studied watershed using a GIS-based procedure (
Flood regulating ecosystem service supply capacities of the different land cover classes in Vidima watershed.
|
Land cover classes |
Flood regulation capacity |
|
112 Discontinuous urban fabric |
0 |
|
121 Industrial or commercial units |
0 |
|
211 Non-irrigated arable lands |
1 |
|
222 Fruit trees and berries |
3 |
|
231 Pastures |
2 |
|
242 Complex cultivation patterns |
3 |
|
243 Agriculture and natural vegetation |
3 |
|
311 Broad-leaved forests |
4 |
|
312 Coniferous forests |
5 |
|
313 Mixed forests |
5 |
|
321 Natural grasslands |
2 |
|
322 Moors and heathland |
3 |
|
324 Transitional woodland-shrub |
3 |
|
332 Bare rocks |
0 |
|
333 Sparsely vegetated areas |
1 |
The map of flood regulation supply capacities (Fig.
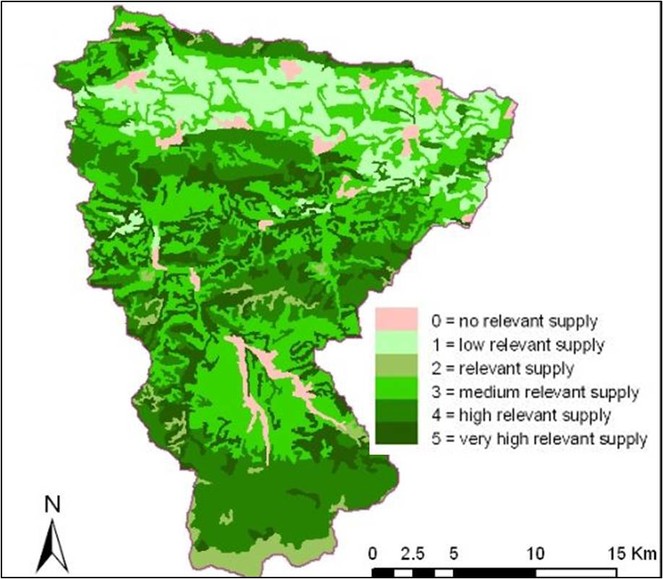
the relatively high share of forest land cover types in this area. The areas with low and no relevant capacities comprise about 15% of the watershed. They are located mainly in the northern part of the watershed where the river valley is wide and relatively flat which allows for more and larger urban and agricultural areas.
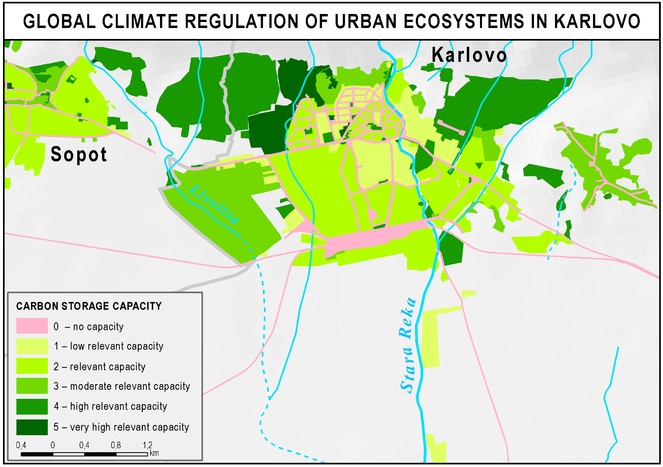
Carbon storage mapping in the Town of Karlovo
The urban ecosystems in the town of Karlovo have been identified and mapped according to the typology of the urban ecosystems developed by
Carbon storage supply capacities according to the amount of carbon per polygon. The capacity classes correspond to the classes in Fig.
|
Capacity |
0 |
1 |
2 |
3 |
4 |
5 |
|
C t/ha |
0 |
0.1 – 33.3 |
33.4-39.3 |
39.4-54.5 |
54.6-66.1 |
66.1-83.64 |
The results from Table 5 have been used to produce a map of carbon storage capacity in the town of Karlovo (Fig.
The results of the calculation per polygons have been used to summarise the carbon storage in the different ecosystem subtypes, in the elements of the vegetation and soils, as well as in the town as a whole (Table
|
C soil |
C trees |
C schrub |
C grass |
C veg |
C Total |
C t/ha |
|
|
J1 |
5980 |
2823 |
0 |
102 |
2925 |
8905 |
39.1 |
|
J3 |
18392 |
5676 |
8 |
314 |
5999 |
24391 |
51.8 |
|
J5 |
6565 |
1383 |
5 |
117 |
1505 |
8070 |
65.2 |
|
J6 |
4825 |
1627 |
0 |
94 |
1721 |
6546 |
39.2 |
|
J7 |
575 |
817 |
0 |
10 |
827 |
1403 |
10.7 |
|
J9 |
297 |
0 |
0 |
10 |
10 |
307 |
18.2 |
|
sum |
36636 |
12327 |
13 |
646 |
12986 |
49622 |
Discussion and conclusions
Discussion
This paper follows the general structure of the framework for integrated mapping and assessment of ecosystem services provided by
The spreadsheet application enables the identification of the concrete bundle of ecosystem services in the case study area and the execution of the initial ES assessment. The results can be conveniently presented in the form of maps for either individual or bundles of ecosystem services. The maps of the Central Balkan area, presented above, show a very high supply capacity for regulating services, including flooding and global climate regulation. These results are mainly based on expert judgment and should be considered just as a starting point for further more precise assessment. The method itself is very useful for the identification of ES delivered by ecosystems at step 4b from the
The biophysical methods applied in this study ensure quantification of ES indicators for two important services: flood regulation and global climate regulation. Mountain watersheds in the case study area are characteristic for their high supply capacity for flood regulation, due to the high degree of forestation. At the same time, the area is flood prone, due to the high frequency of heavy rains on the north steep mountain slopes of the Balkan Mountain Range. Therefore, further work in this field should be directed to mapping and assessment of flood regulation demand in order to support the policy for natural hazard prevention. This important issue is related to many different policy aspects, such as planning adaptation to climate change extremes, investment efficiency etc. To address them adequately, it is best to focus on tier 3 level and use scenario-based mapping of flood regulation ES. In this way, flood risk managers will be able to choose optimal management decisions and to integrate the results of the assessment in the particular policy context.
The global climate regulation approach relies on estimations of carbon storage in the vegetation and soils. The uncertainty in the assessments of soil organic carbon storage is due to errors in soil density and rock fraction estimates, lack of data on organic carbon variability and missing or poorly quantified data for below-ground biomass and environmental control parameters. Information about above-ground biomass in different vegetation cover types also needs more detail. Carbon storage in soil and vegetation is strongly influenced by the size of the area covered by each urban ecosystem subtype and the presence or absence of some ecosystem subtypes in the given territory. That is the reason whythe assessment has to be carried out in accordance with an analysis of the spatial infrastructure of the respective territory (
The data collection and mapping approaches used in the Karlovo Case Study involve significant generalisations. These show weaknesses in the case of concrete ecosystems or business localisations and are, therefore, more suitable for strategic analyses. Another, often overlooked “mapping” discrepancy, is related to the large share of tourism and recreation services consumed in the natural ecosystems, while the largest part of the actual reporting and accounting happens and is mapped in the urban areas’ services (
Practical application of ES knowledge enables the territorial integration of interests, activities, policies and overall governance. This, in turn, creates a basis for active management of ecosystems as service sources, while maintaining a sustained motivation for the local community and other stakeholders to cooperate in the process. The expected long-term outcome is to achieve simultaneous results in the environmental, social, cultural, political and economic aspects of sustainable development in the respective area.
Conclusions
In the last 10 years, ecosystem services’ studies in Bulgaria provide a consistent and fast developing basis for further development of the concept and its application in policy- and decision-making. Promising results have been achieved particularly in biophysical assessment of flood regulation, erosion regulation and carbon storage, which were mapped in several case studies throughout the country. The spreadsheet, spatial proxy and process-based methods have been used in the process. Promising results have also been in the application of economic methods, such as contingent valuation, market price and value transfer, which have been applied with considerable success for bundles of ecosystem services in several case studies. The methodological framework for mapping and assessment of ecosystems and their services at national level ensures widespread implementation of the MAES process in the country. The results of its application for the main ecosystem types in the country provide the initial database for mapping and assessment of a constantly widening range of ecosystem services.
The Central Balkan case studies provide relevant examples for implementation of integrated mapping and assessment of ecosystem services at local level. Following the
Acknowledgements
This study is supported by ESMERALDA (Enhancing ecosystem sERvices mApping for poLicy and Decision mAking) project funded by the European Union’s Horizon 2020 research and innovation programme under grant agreement No 642007 (http://www.esmeralda-project.eu/). The study is also supported by: the "National, European, and Civilizational Dimensions of the Culture – Language – Media Dialogue" Programme of the "Alma Mater" University Complex for the Humanities at Sofia University "Saint Kliment Ohridski", funded by the Bulgarian Ministry of Education, Youth and Science Scientific Research Fund; the project “Toward better understanding of ecosystem services in urban environments through mapping and assessment (TUNESinURB)”, funded by the FM of EEA 2009-2014 (www.tunesinurb.org); Project PDP02 - Methodological Support for Ecosystem Services Mapping and Biophysical Valuation (MetEcoSMap), funded by the FM of EEA 2009-2014 (www.metecosmap-sofia.org).
References
- Value of Ecosystems (Landscape) Services in the Area of the Towns of Apriltsi, Kalofer and Smolyan.Annuals, Sofia University St. Kliment Ohridski2(107):141‑163. [InBulgarian].
- Research of the Biotope Diversity for the Purposes of Economic Valuation of Ecosystem Services in Chepelare Municipality (The Rhodopes Region of Bulgaria). In.European Journal of Sustainable Development, Special Issue –5(4):409‑420.
- Determination of the Landscapes Regulation Capacity and Their Role in the Prevention of Catastrophic Events: A Case Study from the.In: Koulov, B. and G. Zhelezov (eds.) Sustainable Mountain Regions: Challenges and Perspectives in Southeastern Europe.Lom River Upper,Valley, Bulgaria. URL: http://www.springer.com/gp/book/9783319279039 [ISBN978-3-319-27903-9.]
- Bulgarian Biodiversity Foundation "For the Balkans and the Humans" Project won an European Commission."NATURA 2000" awardURL: http://bbf.biodiversity.bg/bg/PROEKTYT-ZA-BALKANA-I-HORATA-SPEChELI-NAGRADATA-NATURA-2000-NA-EVROPEYSKATA-KOMISIYa.p1633 (accessed on 25.01.2018)
- Landscape ecology and landscape planning.Prof. Marin Drinov Academic publishing house,,Sofia,284pp. [InBulgaria]. [ISBNISBN 978-954-332-670-2]
- Borisova B, Assenov A, Dimitrov P (2015) The Natural Capital of Selected Mountain Areas in Bulgaria. Springer Geography. https://doi.org/10.1007/978-3-319-13527-4_6
- Boyanova K, Nedkov S, Burkhard B (2014) Quantification and Mapping of Flood Regulating Ecosystem Services in Different Watersheds – Case Studies in Bulgaria and Arizona, USA. Lecture Notes in Geoinformation and Cartography. https://doi.org/10.1007/978-3-319-08180-9_18
- Boyanova K (2015) Spatial analysis and assessment of ecosystem services in mountain watersheds using geospatial technologies.PhD Thesis,175pp. [InBulgarian].
- Boyanova K, Nedkov S, Burkhard B (2016) Applications of GIS-Based Hydrological Models in Mountain Areas in Bulgaria for Ecosystem Services Assessment: Issues and Advantages. Sustainable Mountain Regions: Challenges and Perspectives in Southeastern Europe. https://doi.org/10.1007/978-3-319-27905-3_3
- RESILIENCE OF ECOSYSTEM SERVICES - APPLYING ECOSYSTEM FUNCTION AND INTEGRITY CONCEPTS TO NATURAL SWEET CHESTNUT FORESTS IN BELASITZA MOUNTAIN (SW BULGARIA).Acta Horticulturae1043:183‑190. https://doi.org/10.17660/actahortic.2014.1043.24
- Clorind. [ISBNISBN 978-619-7379-21-1].
- Landscapes capacities to provide ecosystem services – a concept for land-cover based assessments.Landscape Online15:1‑22.
- Ecosystem services – Bridging ecology, economy and social sciences.Ecological Complexity7(3):257‑259. https://doi.org/10.1016/j.ecocom.2010.07.001
- Mapping ecosystem service supply, demand and budgets.Ecological Indicators21:17‑29. https://doi.org/10.1016/j.ecolind.2011.06.019
- Ecosystem Service Potentials, Flows and Demands – Concepts for Spatial Localisation, Indication and Quantification.Landscape Online1‑32. https://doi.org/10.3097/lo.201434
- Mapping and assessing ecosystems services in the EU – The ESMERALDA coordination and support action approach of integration.One Ecosystem(in preparation).
- An operational framework for integrated Mapping and Assessment of Ecosystems and their Services (MAES).One Ecosystem3:e22831. https://doi.org/10.3897/oneeco.3.e22831
- Chipev N, Bratanova-Doncheva S, Kr. Gocheva MZ, Mondeshka M, Yordanov Y, Apostolova I, Sopotlieva D, Velev N, El. Rafailova YU, Karamfilov V, Fikova R, Vergiev S (2017) GUIDE FOR MONITORING OF TRENDS IN ECOSYSTEM CONDITION AND ECOSYSTEM SERVICES. Clorind. [ISBN978-619-7379-25-9].
- Dimitrova L, Petrova D, Belev T, Todorov T, Grigorova-Ivanova J, Shuleva N (2015) Valuation of Ecosystem Services provided by the Forest the Central Balkan National Park. Central Balkan National Park. [InBulgarian]. URL: http://visitcentralbalkan.net/assets/userfiles/%D0%91%D0%B0%D0%BB%D0%BA%D0%B0%D0%BD%D1%8A%D1%82/NPCB_EcosystemServicess.pdf
- Integrated assessment of urban green infrastructure condition in Karlovo urban area by in-situ observations and remote sensing.One Ecosystem3:e21610. https://doi.org/10.3897/oneeco.3.e21610
- Description of Action (DoA).Pensoft,Sofia,178pp.
- Identifying representative case studies for ecosystem services mapping and assessment across Europe.One Ecosystem[Inpreparation].
- Valuing Ecosystem Services for Sustainable Landscape Planning in Alpine Regions.Mountain Research and Development28(2):156‑165. https://doi.org/10.1659/mrd.0951
- A tiered approach for mapping ecosystem services.Ecosystem Services13:16‑27. https://doi.org/10.1016/j.ecoser.2014.10.008
- Natural capital and ecosystem services informing decisions: From promise to practice.Proceedings of the National Academy of Sciences112(24):7348‑7355. https://doi.org/10.1073/pnas.1503751112
- Haines-Young R, Potchin M (2013) CICES V4.3 - Report prepared following consultation on CICES Version 4. Undefined EEA Framework Contract No EEA/IEA/09/003. URL: https://unstats.un.org/unsd/envaccounting/seeaRev/GCComments/CICES_Report.pdf
- GIS-based Valuation of Ecosystem Services in Mountain Regions: A Case Study of the Chepelare Municipality in Bulgaria.European Journal of Sustainable Development, Special Issue –5(4):335‑346. URL: http://www.ecsdev.org/index.php/publications/ejsd
- GIS-based Valuation of Ecosystem Services in Mountain Regions: A Case Study of the Karlovo Municipality in Bulgaria.One Ecosystem2:e14062. https://doi.org/10.3897/oneeco.2.e14062
- Koulov B, Borisova B (2018) Ecosystem Services: Concept, Opportunities and Limitations for its Implementation in Bulgaria Scientific Works of USB - Plovdiv. Series B. Natural Sciences and Humanities (in bulgarian) ISSN. Scientific Works of USB - Plovdiv. Series B. Natural Sciences and Humanities. [InBulgarian]. [ISBNISSN 1311-9192 (in press)].
- Atlas of soils in Bulgaria.Zemizdat,Sofia,321pp. [InBulgarian]. [ISBN954-05-0116-4]
- Lima Action Plan for UNESCO’s Man and the Biosphere (MAB) Programme and its World Network of Biosphere Reserves.UNESCOURL: http://www.unesco.org/fileadmin/MULTIMEDIA/HQ/SC/pdf/Lima_Action_Plan_en_final.pdf
- Mapping and Assessment of Ecosystems and their Services. An analytical framework for ecosystem assessments under.Publications office of the European Union, Luxemburg(57 pp). URL: http://ec.europa.eu/environment/nature/knowledge/ecosystem_assessment/pdf/MAESWorkingPaper2013.pdf
- Enhancing Resilience Of Urban Ecosystems through Green Infrastructure.Publications Office of the European. Union, LuxemburgURL: http://publications.jrc.ec.europa.eu/repository/bitstream/JRC106443/enrouteinceptionreportfinal.pdf
- Ministry of Agriculture and Food, Republic of Bulgaria: Agrostatistical Reference Book.Ministry of agriculture and FoodURL: http://www.mzh.government.bg/MZH/en/ShortLinks/SelskaPolitika/Agrostatistics.aspx
- Proceedings, 6th International Conference on Cartography and GIS, 13-17 June 2016.Albena, Bulgaria
- Nedkov S (2011) Landscape Structure and Ecosystem Services of Etropole Municipality. In: Zhelezov G (Ed.) Sustainable Development in Mountain Regions, Southeastern Europe.South Eastern Europe, Springerhttps://doi.org/10.1007/978-94-007-0131-1_8
- Flood regulating ecosystem services—Mapping supply and demand, in the Etropole municipality, Bulgaria.Ecological Indicators21:67‑79. https://doi.org/10.1016/j.ecolind.2011.06.022
- Nedkov S, Gikov A, Nikolova M, Dimitrov P, Gachev E (2014) Mapping of ecosystem services in mountain areas: a case study of Seven Rila Lakes 5th International conference on Cartography and GIS. In: Bandrova T, Konechny M (Eds) 5th International conference on Cartography and GIS.Riviera, Bulgaria,488-497pp.
- Proceedings of the scientific conference “Geographical aspects of land use and planning under climate change”. URL: http://geography.bg/images/dokladi/33.pdf [ISBNISBN: 978-619-90446-1-2].
- Mapping and assessment of urban ecosystem condition and services using integrated index of spatial structure.One Ecosystem2:e14499. https://doi.org/10.3897/oneeco.2.e14499
- National Reference Centre.Ministry of Environment and WaterURL: http://www.nsi.bg/en/content/4247/prices-agricultural-production-data-series
- National Statistical Institute, Republic of Bulgaria: Regional statistics data series.National Statistial InstituteURL: http://www.nsi.bg/en/content/11252/regional-statistics-and-indicators-monitoring
- National Statistical Institute, Republic of Bulgaria: Prices of agricultural production data series.Nationla Statistical InstituteURL: http://www.nsi.bg/en/content/4247/prices-agricultural-production-data-series
- National Statistical Institute, Republic of Bulgaria. Demography.National Statistical Institute.
- Pehlivanov L, Fikova R, Ivanova N, Kalchev R, Kazakov S, Pavlova M, Bratanova-Doncheva S (2014) Analysis of Ecosystem Services of Wetlands along the Bulgarian Section of the Danube River. Acta Zoologica Bulgarica.
- Operationalising ecosystem service approaches for governance: Do measuring, mapping and valuing integrate sector-specific knowledge systems?Ecosystem Services1(1):85‑92. https://doi.org/10.1016/j.ecoser.2012.07.008
- Rashev B (2003) Alternative Economic Valuation of Pirin National Park, Bulgaria. [Master thesis].Brandenburg University of Technology,Cottbus, Germany.
- Process matters: a framework for conducting decision-relevant assessments of ecosystem services.International Journal of Biodiversity Science, Ecosystem Services & Management11(3):190‑204. https://doi.org/10.1080/21513732.2014.966149
- National Ecosystem Assessments in Europe: A Review.BioScience66(10):813‑828. https://doi.org/10.1093/biosci/biw101
- ESMERALDA Mid-term project Meeting and Workshop VI on Flexible methods for mapping and assessing ecosystem services.ESMERALDA Project, Grant Agreement642007.
- Biosphere Reserves under the UNESCO’s “Man and Biosphere” Programme as a Tool for Regional Development and Understanding the Complete Potential of Ecosystem Services (Using the Example of Central Balkan National Park).Annuals, Sofia University St.Kliment Ohridski2:120‑143. [InBulgarian].
- UK, NEA (2011) The UK National Ecosystem Assessment: Synthesis of the Key Findings.UNEP-WCMC,Cambridge.
- UNESCO (1996) Biosphere reserves: The Seville Strategy and the Statutory Framework of the World Network.UNESCO,Paris.
- Review of the ecosystem services and the values they provide. Rhodope project.UNDP
- Role of different components of urban and peri-urban forests to store carbon – a case-study of the Sandanski region, Bulgaria.Journal of Chemical, Biological and Physical Sciences. JCBPS, Section D2015(5):3114‑3128.
- Zhiyanski M, Gikov A, Nedkov S, Dimitrov P, Naydenova L (2016) Mapping Carbon Storage Using Land Cover/Land Use Data in the Area of Beklemeto, Central Balkan. Sustainable Mountain Regions: Challenges and Perspectives in Southeastern Europe. https://doi.org/10.1007/978-3-319-27905-3_4
- Methodology for assessment and Mapping of Urban ecosystems their state, and the services that they provide in Bulgaria.Clorind,58pp.
- Proceedings of 3rd International Conference “Ecology of urban areas 2013”.Zrenjanin
Supplementary materials
The table presents review of main ES activities in Bulgaria