|
One Ecosystem :
Methods
|
|
Corresponding author: Miguel Villoslada (mpecina@emu.ee)
Academic editor: Fernando Santos
Received: 30 Mar 2018 | Accepted: 27 Jul 2018 | Published: 17 Aug 2018
© 2018 Miguel Villoslada, Ivo Vinogradovs, Anda Ruskule, Kristina Veidemane, Olgerts Nikodemus, Raimonds Kasparinskis, Kalev Sepp, Justas Gulbinas
This is an open access article distributed under the terms of the Creative Commons Attribution License (CC BY 4.0), which permits unrestricted use, distribution, and reproduction in any medium, provided the original author and source are credited.
Citation:
Villoslada M, Vinogradovs I, Ruskule A, Veidemane K, Nikodemus O, Kasparinskis R, Sepp K, Gulbinas J (2018) A multitiered approach for grassland ecosystem services mapping and assessment: The Viva Grass tool. One Ecosystem 3: e25380. https://doi.org/10.3897/oneeco.3.e25380
|
|
Abstract
Throughout the second half of the 20th Century, the area of semi-natural grasslands in the Baltic States decreased substantially, due to agricultural abandonment in some areas and intensification in more productive soil types. In order to halt the loss of biodiversity and ecosystem services provided by grasslands, the LIFE+ programme funded project, LIFE Viva Grass, aims at developing an integrated planning tool that will support ecosystem-based planning and sustainable grassland management. LIFE Viva Grass integrated planning tool is spatially explicit and allows the user to assess the provision and trade-offs of grassland ecosystem services within eight project case study areas in Estonia, Latvia and Lithuania.
In order to ensure methodological adaptability, the structure of the LIFE Viva Grass integrated planning tool follows the framework of the tiered approach. In a multi-tier system, each consecutive tier entails an increase in data requirements, methodological complexity or both. The present paper outlines the adaptation of the tiered approach for mapping and assessing ecosystem services provided by grasslands in the Baltic States. The first tier corresponds to a deliberative decision process: The matrix approach is used to assess the potential supply of grassland ecosystem services based on expert estimations. Expert values are subsequently transferred to grassland units and therefore made spatially explicit. The data collected in the first tier was further enhanced through a Principal Components Analysis (PCA) in order to explore ES bundles in tier 2. In the third tier, Multi-Criteria Decision Analysis is used to target specific policy questions.
Keywords
Ecosystem services, grasslands, tiered approach, integrated planning
Introduction
Semi-natural grasslands represent complex ecosystems that provide a variety of different ecosystem functions and services, essential for maintenance of biodiversity as well as for survival and well-being of human society (
In the Baltic States, as in many parts of Europe, rural areas are undergoing the process of marginalisation and related social and economic decline, that is resulting in depopulation, departure from the labour force and consequent abandonment of grasslands (
The EU Common Agricultural Policy (CAP) is recognised as a major driver of agricultural land use, influencing rural development, landscape change as well as determining the grassland management practices (
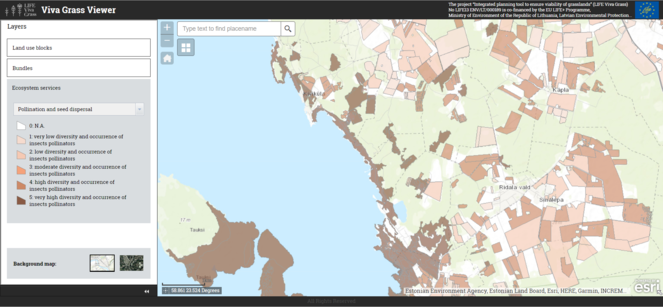
The project “Integrated planning tool to ensure viability of grasslands – LIFE Viva Grass” aims to support the maintenance of biodiversity and ES provided by grasslands, through encouraging ecosystem-based planning and economically viable grassland management. The major task of the project is implementing the aims and objectives through an Integrated Planning Tool (hereinafter the Viva Grass tool) that will help to make decisions for sustainable grassland management by strengthening linkages between social, economic, environmental, agricultural fields and policies, emphasising the ES approach. The Viva Grass tool, developed within the project, provides spatially explicit decision support for landscape and spatial planning that sustains biodiversity, fortifies the provision of ES in agroecosystems, aims to prevent loss of High Nature Value Grasslands and increases the efficiency of semi-natural grassland management. The tool is integrated into an online GIS working environment which allows users to assess the provision and trade-offs of grassland ES in user-defined areas. The tool is divided into two sections: a general information platform freely available for the general public and a planning-orientated platform available only for registered users. LIFE Viva Grass encompasses nine case study areas (two farms, four municipalities, two protected areas and one county) across the three Baltic States (Estonia, Latvia and Lithuania).
Recent literature shows a wide array of integrated modelling systems aimed at supporting environmental decision-making, with an increased integration of the ES framework (
The aim of this paper is to describe a methodology for the adaptation of the tiered approach to map and assess the supply of ES by grassland in the Baltic States. Furthermore, the paper outlines the implementation of the tiered approach into an integrated planning tool aimed at informing and supporting decisions related to sustainable grassland management. Beyond the methodological description, the advantages and shortcomings of such an approach are discussed.
Methods
Data availability: Towards a typology for grassland ES assessment
The spatial scale of the project posed a challenge in terms of data availability and data homogenisation. European-scale maps such as CORINE land cover (
The potential delivery of ES is determined by the interaction of natural capital attributes, comprising both biotic and abiotic component and human inputs and management strategies (
1. The underlying natural conditions: Two factors were selected as descriptors of the environmental conditions that underpin the provision of ES in the grasslands of the Baltic States: Land quality and slope. The concept of land quality is an integrated evaluation of fertility of soils used in the Baltic States' land evaluation systems and is composed of several factors, e.g. soil texture, soil type, topography, stoniness and level of cultivation (pH, A horizon dip, amount of organic matter). Land quality is expressed in points per hectare with 100 points being maximum (
The slope has little or no direct influence on the yield of crops, but steeper slopes are associated with shallower soils with less water retention capacity due to gravity and with a higher risk for soil erosion (
- plain surface (0o – 4o),
- gentle steepness (5o – 10o) and
- steep slope (>10o).
The categories were created during expert assessment and designated as erosion potentiality where: the first category represented no soil erosion, second category – minimal soil erosion and third category - noteworthy soil erosion potential. The slope dataset was generated from DEMs (10 m cell) (Fig.
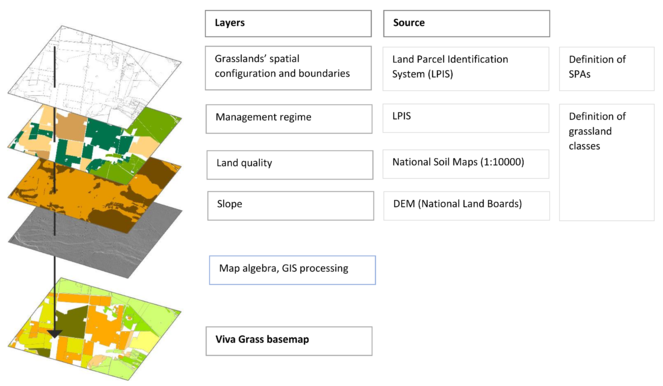
2. The management regime of the grasslands: Three types of grassland management regimes and one type of cropland were considered in the analysis as the foundation for creating the ES supply potential basemap, namely: cultivated, permanent, semi-natural grasslands and arable/cropland. One of the main driving factors for different supply potential of ES in grasslands is the intensity of management or level of interference in topsoil. Cultivated grasslands are seeded (often a monoculture – Festuca sp., Phleum sp., Dactylis sp.) and ploughed, usually included in crop rotation and less than five years of age. Cutting of grass is undertaken several (up to four) times a season. Fertilisation is also a common practice to maintain high yields. Cultivated grasslands are associated with intensive farming systems. Permanent grasslands are generally defined as land used to grow grasses naturally or through cultivation which is older than five years. This type of grasslands is rarely seeded, contain both natural vegetation and cultivated species. Permanent grasslands are excluded from crop rotation, mostly used as hay fields and cut not more than two times a season or used as pastures. Permanent grasslands are associated with low input farming systems. Semi-natural grasslands are the result of decades or centuries of low-intensity management and are currently not seeded or ploughed. Semi-natural grasslands contain high levels of biodiversity (
The grassland classes alone do not account for the spatial dimension of ES. As pointed out by
The national Integrated Administration and Control Systems (IACS) were selected as the source of information for grassland management regime and map’s basic spatial unit or SPAs. IACS databases are the most important system for the management and control of payments to farmers in the EU and contain a system for the identification of all agricultural parcels and their management regime. IACS have the same structure throughout EU, consequently simplifying the process of data integration within a transnational basemap.
Each of the above-mentioned factors is represented by one spatial layer and were combined in a GIS environment through map algebra and GIS processing operations. Fig.
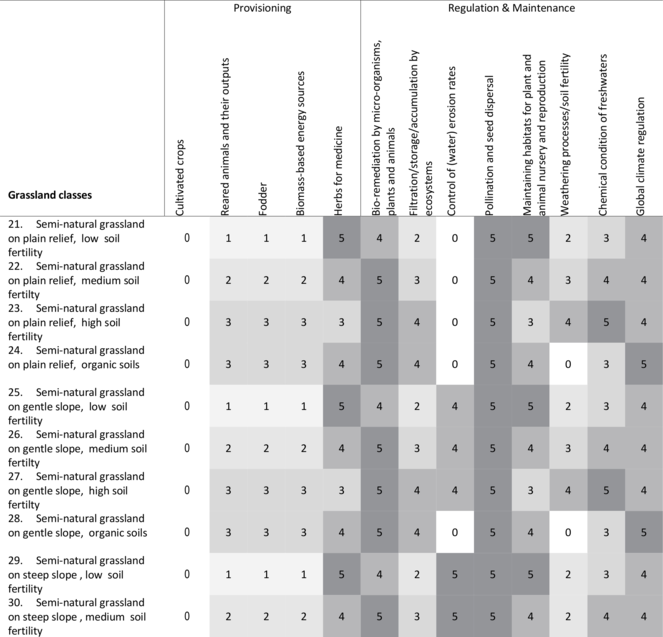
Extract of the expert-based scores matrix including grassland classes 21 to 30, corresponding to semi-natural grasslands. A total of 30 grassland classes plus 10 arable land classes were evaluated. The full version of the expert-based scores matrix is included as a supplementary file (Suppl. material
The tiered approach
One of the main aims of the Viva Grass project is offering integrated, ecosystem-based planning solutions based on economically viable grassland management scenarios. Additionally, the implementation of economically viable grassland management models targets areas of different natural and socio-economic contexts. Given the spatially explicit nature of the processes being addressed in the project, there is a need to establish links between spatial data on ES, agricultural, natural and socio-economic contexts in order to achieve the above-mentioned goals. The multi-scale nature of Viva Grass case studies, as well as the differences in data availability and spatial and thematic scales across the three Baltic States, require a consistent but flexible approach. As it has been pointed by
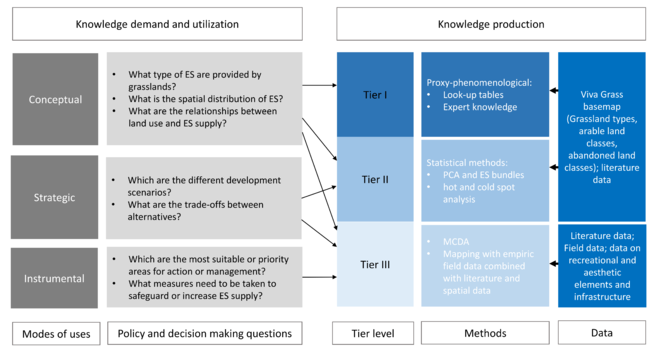
Policy- and decision-makers face different challenges, thus their demand for knowledge on ES varies depending on their specific management needs (
Tier 1
At tier 1, the potential supply of grassland ES is assessed through the matrix approach based on multiple datasets.This type of tools often uses landuse or landcover data to map ES supply and demand (
Within Viva Grass, the tiered approach with expert-based scores was used exclusively to assess the supply of ES belonging to the provisioning and regulating and maintenance categories (
Five experts per country (Estonia, Latvia and Lithuania) were selected for the grassland ES supply valuation. The selection was based on the experts’ knowledge of grassland ecology, agricultural management, agri-environmental policy and the study areas. The valuation of ES potential supply was structured as a three-step process: in the first step, the international experts panel selected a relevant set of ES provided by grasslands and one indicator per ES. The selection of ES was based on the experts' knowledge on grasslands' ecosystem and recent literature (
ES indicators and factors determining ES potential. The list of indicators was provided in order to build a common understanding of the ES under assessment.
*in case of drained soils the value shall be lowered by 1 unit.
| Ecosystem service | Indicator | Factors determining ES potential |
|---|---|---|
| Provisioning services | ||
|
Cultivated crops |
yield (t/ha per year) |
Only arable land + soil fertility |
|
Reared animals and their outputs |
Number of Livestock Unit (LU/ha) |
Land use + soil fertility |
|
Fodder |
dry weight of grass biomass |
Land use + soil fertility |
|
Biomass-based energy sources |
dry weight of grass biomass |
Land use + soil fertility |
|
Herbs for medicine |
Number of species and abundance |
Land use + soil fertility |
| Regulating services | ||
|
Bio-remediation |
- |
Land use + soil fertility |
|
Filtration/storage/accumulation |
Soil capacity to store/accumulate nutrients (Kg ha-1) * |
Land use + soil fertility |
|
Control of (water) erosion rates |
Amount of soil retained (kg/ha per year) |
Land use + soil fertility + relief |
|
Pollination and seed dispersal |
Diversity and occurrence of insects- pollinators (number of species and number of individuals/ha) |
Land use |
|
Maintaining habitats |
Number of species per 1 m2 (except invasive species) |
Land use + soil fertility |
|
Weathering processes/soil fertility |
Nutrients available for plant uptake by most important soil texture classes |
Land use + soil fertility + relief |
|
Chemical condition of freshwaters |
Absorption of nutrients |
Land use + soil fertility |
|
Global climate regulation |
Carbon sequestration in vegetation and soils |
Land use + soil fertility |
Tier 2
The qualitative nature of expert-based assessments is not an obstacle for deeper, statistics-based analysis. The data collected in the first tier was further enhanced through a Principal Components Analysis (PCA) in order to explore ES bundles in tier 2. Focusing on single ES in mapping and assessment processes may lead to an unbalanced use or overexploitation of ecosystems (
A Principal Components Analysis was carried out using the qualitative scores for grassland plots (observations) and ES (variables) based on the matrix as input data.
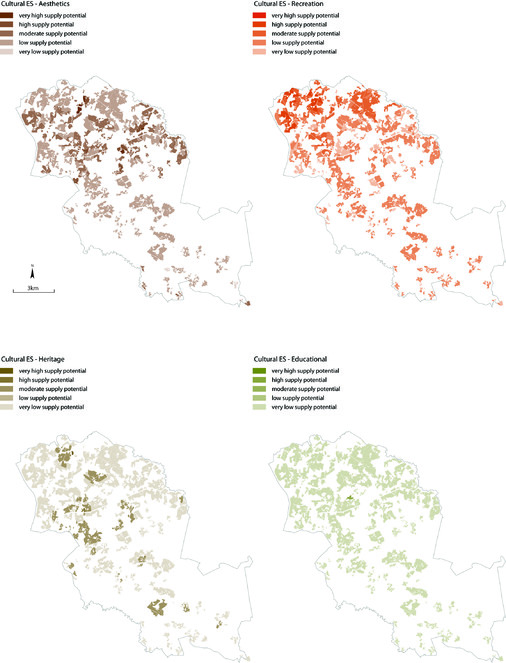
Cultural ecosystem services
Tier 2 also includes the assessment of cultural ES. The nature of cultural ecosystem services provided by grasslands is context-specific and the factors that determine the provision of this set of services often show local-scale differences. In this regard, experts knowledge may not fully account for the local landscape attributes related to cultural ecosystem services. Consequently, the Viva Grass methodology evaluates cultural ES in the context of each grassland’s surrounding landscape and its features. This approach has been identified by
The selection of evaluation criteria for aesthetic value and cultural heritage was undertaken based on the assessment of preferences for agricultural landscapes by
|
Ecosystem services |
Landscape features |
Buffering distance |
|
1. Physical and experiential interactions (recreational) |
Rural recreational enterprises |
3 km |
|
Watching towers |
300 m |
|
|
Tourist trails |
100 m |
|
|
Area of hunting clubs |
0 m |
|
|
Camping sites |
300 m |
|
|
Social gathering sites |
300 m |
|
|
2. Educational |
Educational trails |
100 m |
|
Educational sites |
100 m |
|
|
3. Cultural heritage |
Monuments |
100 m |
|
Farmsteads before and in 19th century |
100 m |
|
|
Traditional land use (Wooded meadow) |
300 m |
|
|
4. Aesthetics |
Water bodies, streams |
300 m |
|
Naturalness of surroundings |
100 m |
|
|
Naturalness of grassland itself |
from attributes of base map |
|
|
Linear elements |
300 m / from 1:10000 map hedgerows, stone walls. |
|
|
Relief |
STD of topography=10 as threshold in 5x5 km cells |
|
|
Openness |
country specific density of forest in 5x5 km |
Tier 3
The nature of the analyses carried on the third tier are driven by the policy questions addressed. Similarly, the variables used are directly related to the questions and stakeholders targeted at this level of the multitier framework (see Fig.
Multi-Criteria Decision Analysis (MCDA) has been described as a framework that assists decision-making processes with multiple objectives and stakeholders, taking into consideration multiple criteria (
As stated by
Within the framework of the Viva Grass project, MCDA has been used, not only to evaluate the potential supply of certain ES, but also to spatially locate the demand forsuch services. MCDA models were used to develop three Decision Management Systems (DMSs). Each DMS is constructed based on a distinct MCDA structure and targets one or more specific policy questions. The expert scores obtained in the first tier are used as input data in the MCDA models and further enhanced with the results from the bundles analysis in tier 2 and additional information relevant to the policy question or management problem being addressed. Some of the data used in the MCDA are included as causal relationships, used to link the grassland categories to data collected from literature or national statistics. In other cases, MCDA uses data specific to the particular grassland polygon. All MCDA models are constructed on a GIS-based environment in order to obtain spatially explicit outcomes and to facilitate the integration of results in different local and regional planning processes.
In addition to the methods described above, the online tool allows users to update ES values on specific areas by uploading direct data acquired by field measurements. Primary data can be used to estimate ES stock or flow values but are restricted at the site level. However, if the sampling technique has been designed on the basis of statistical representativeness, primary data can be used as an input to different ES modelling approaches.
Results
The outputs of each tier answer different policy- and decision-making questions (Fig.
At tier 1, the outputs of the three-step expert-based assessment were gathered in a grassland ES matrix. Fig.
At tier 2, the PCA revealed 3 main components which correspond to three bundles accounting for 90.53% of the total variance (Table
Factor loadings showing the correlation between the original variables (ES) and the components extracted by the PCA. An ES was retained in a bundle if the factor loading was higher than 0.5.
| Ecosystem Services | 1st Component | 2nd Component | 3rd Component | |
|---|---|---|---|---|
| Provisioning | Reared animals and their outputs | -0.958 | ||
| Fodder | -0.807 | |||
| Biomass-based energy sources | -0.808 | |||
| Herbs for medicine | 0.921 | |||
|
Regulation & Maintenance |
Pollination and seed dispersal | 0.846 | ||
| Maintaining habitats for plant and animal nursery and reproduction | 0.953 | |||
| Global climate regulation | 0.726 | |||
| Bio-remediation by micro-organisms, plants and animals | 0.839 | |||
| Filtration/storage/accumulation by ecosystems | 0.845 | |||
| Chemical condition of freshwaters | 0.766 | |||
| Control of (water) erosion rates | 0.608 | |||
| Weathering processes/soil fertility | 0.902 |
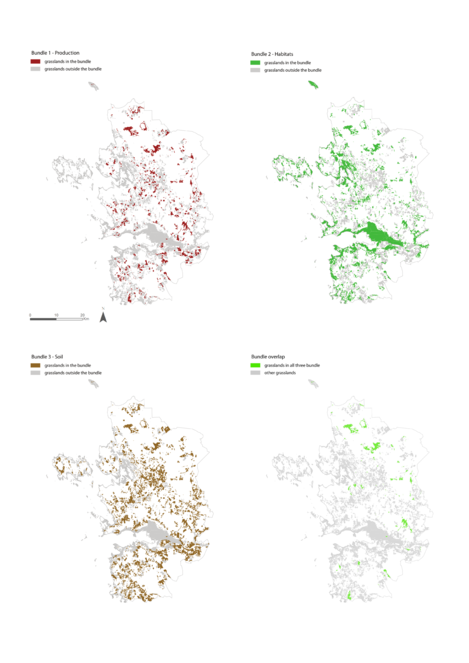
Habitats bundle: Herbs for medicine, maintaining habitats, global climate regulation, pollination and seed dispersal.
Production bundle: Reared animals and their outputs, fodder, biomass based energy sources, cultivated crops.
Soils bundle: Control of erosion rates, chemical condition of fresh waters, bio-remediation, filtration/storage/accumulation by ecosystems and weathering processes-soil fertility. The soils bundle includes both the second and the third component.
Naming the bundles helps communicate relevant information about the effects of different management strategies. In the context of ES, PCA has been used on qualitative matrix-based evaluations by
Visualising the spatial configuration of ES bundles is an essential step in order to incorporate the concept into planning processes. A grassland was mapped as belonging to a certain bundle if all ES in the bundle in that particular grassland scored above average (2.5) (Fig.
Two examples are provided for the results of tier 3. As part of the Viva Grass tool, the MCDA approach has been used in Estonia to guide local and regional planners in the implementation of the Green Network. The Green Network of Estonia complements the network of protected areas, combining them with natural and semi-natural areas into a coherent network at various geographical levels (
In one of the Latvian case study areas, the Viva Grass Integrated Planning tool was tested to support the landscape management planning at the municipality level. The MCDA approach was applied to prioritise sites for landscape maintenance or restoration measures. The criteria for prioritisation included the value of the four cultural services (recreational, educational, cultural heritage and aesthetic) as well as ecological value (based on the habitats bundle – herbs for medicine, maintaining habitats, global climate regulation, pollination and seed dispersal). A local stakeholder group was involved in the weighting of the selected five criteria. The results of the prioritisation were used to determine site specific management measures for maintenance or improvement of landscape quality, which can serve as input to the municipality land-use policy documents.
Discussion
In recent years, several authors have undertaken the analysis of grasslands' value and multi-functionality from the ES perspective (
Data and maps availability has been identified as a main constraint in ES supply and demand assessments (
The lack of accurate biophysical data also affects the evaluation of ES supply and demand, reducing the choice of available ES mapping and assessment methods. In this regard, expert knowledge has been widely used as a substitute for biophysical methods in data-scarce environments (
In the cases when data was available, MCDA models were developed and integrated into tier 3 in order to answer specific grassland-related policy questions. The MCDA models, developed in Viva Grass, use the results of the matrix model as input data, which is later enhanced with supplementary data. However, there are some risks associated with the use of MCDA.
Regarding cultural ES, the aesthetic and recreational values are often regionally specific, depending upon the preferences stated by population (
Conclusions
The methodology developed within Viva Grass represents a cost-efficient and flexible way of evaluating the supply of grasslands ES at different spatial scales, in different regional contexts, addressing a wide range of grassland-related management, planning and policy issues. The multi-tier structure of the Viva Grass tool allows users to select the method that best adapts to their knowledge demands. In this regard, the conservation of grasslands in the Baltic States is influenced by different sectoral policies and strategies. It is therefore essential to develop tools that are able to target a wide range of stakeholders. The Viva Grass methodology puts the ES framework into practice through a set of interrelated tools. Using expert-based scores and the Viva Grass basemap, users are able to assess the spatial distribution of grassland ES and the relations between landuse and ES supply. At a strategic and planning level, ES bundles analysis allows evaluating grassland development scenarios. Finally, users can employ a set of MCDA tools to spatially locate the most suitable grasslands for action or management and prioritise measures to safeguard or increase the supply of ES.
The transition of the ES framework from the academic sphere into practical planning applications is expected to grow in the upcoming years, therefore similar tools will be needed to bridge the gap between science, policy and practice. However, methodologies, tools, data and maps alone are not sufficient for a successful implementation of the ES framework (
References
- Why landscapes of the past are important for the future.Landscape and Urban Planning70:21‑34. https://doi.org/10.1016/j.landurbplan.2003.10.002
- Belton V, Stewart T (2002) An Integrated Approach to MCDA. Multiple Criteria Decision Analysis. https://doi.org/10.1007/978-1-4615-1495-4_11
- Zemes izmantošana un kadastrs Latvijā. [Land use and cadaster in Latvia].State land service of Latvia,Riga,408pp. [InLatvian]. [ISBN9984-9508-1-6]
- Bullock JM, Jefferson RG, Blackstock TH, Pakeman RJ, Emmett BA, Pywell RJ, Grime JP, Silvertown J (2011) Semi-natural grasslands. UK National Ecosystem Assessment. Understanding nature's value to society. Technical Report.UNEP-WCMC,Cambridge. [InEnglish].
- Landscapes‘ Capacities to Provide Ecosystem Services – a Concept for Land-Cover Based Assessments.Landscape Online1‑22. https://doi.org/10.3097/lo.200915
- CICES (2015) Version 4.3 towards a common classification of ecosystem services. http://cices.eu/. Accessed on: 2018-1-10.
- Including multiple differing stakeholder values into vulnerability assessments of socio-ecological systems.Global Environmental Change18(3):508‑520. https://doi.org/10.1016/j.gloenvcha.2008.04.005
- Database Dry Grasslands in the Nordic and Baltic Region.Biodiversity & Ecology4:319‑320. https://doi.org/10.7809/b-e.00114
- Mapping ecosystem services potential in Lithuania.International Journal of Sustainable Development & World Ecology23(5):441‑455. https://doi.org/10.1080/13504509.2016.1146176
- Stakeholders’ perspectives on the operationalisation of the ecosystem service concept: Results from 27 case studies.Ecosystem Serviceshttps://doi.org/10.1016/j.ecoser.2017.09.015
- Environmental heterogeneity as a bridge between ecosystem service and visual quality objectives in management, planning and design.Landscape and Urban Planning163:90‑106. https://doi.org/10.1016/j.landurbplan.2017.03.005
- Adsorption and migration of heavy metals in soil.Polish journal of environmental studies10(1):1‑10.
- Integrating methods for ecosystem service assessment: Experiences from real world situations.Ecosystem Serviceshttps://doi.org/10.1016/j.ecoser.2017.10.014
- Does nature conservation enhance ecosystem services delivery?Ecosystem Services17:152‑162. https://doi.org/10.1016/j.ecoser.2015.12.001
- Multi-criteria decision analysis for nature conservation: A review of 20 years of applications.Methods in Ecology and Evolution9(1):42‑53. https://doi.org/10.1111/2041-210x.12899
- The State of Nature in the European Union: Report on the status of and trends for habitat types and species covered by the Birds and Habitats Directives for the 2007-2012 period as required under Article 17 of the Habitats Directive and Article 12 of the Birds Directive.European Commission
- Integrated assessment of ecosystem services in the Czech Republic.Ecosystem Services8:110‑117. https://doi.org/10.1016/j.ecoser.2014.03.001
- Nexus thinking – how ecosystem services can contribute to enhancing the cross-scale and cross-sectoral coherence between land use, spatial planning and policy-making.International Journal of Biodiversity Science, Ecosystem Services & Management13(1):412‑421. https://doi.org/10.1080/21513732.2017.1396257
- Multicriteria analysis for sustainability assessment: concepts and case studies.Handbook of Sustainability Assessment235‑264. https://doi.org/10.4337/9781783471379.00019
- Comparison of methods for a landscape-scale assessment of the cultural ecosystem services associated with different habitats.International Journal of Biodiversity Science, Ecosystem Services & Management14(1):91‑104. https://doi.org/10.1080/21513732.2018.1447016
- Soil function assessment: review of methods for quantifying the contributions of soils to ecosystem services.Land Use Policy69:224‑237. https://doi.org/10.1016/j.landusepol.2017.06.025
- A tiered approach for mapping ecosystem services.Ecosystem Services13:16‑27. https://doi.org/10.1016/j.ecoser.2014.10.008
- Review of decision support tools to operationalize the ecosystem services concept.Ecosystem Services26:306‑315. https://doi.org/10.1016/j.ecoser.2016.10.012
- Relative contributions of plant traits and soil microbial properties to mountain grassland ecosystem services.Journal of Ecology101(1):47‑57. https://doi.org/10.1111/1365-2745.12014
- Changes in grassland management and plant diversity in a marginal region of the Carpathian Mts. in 1999–2015.Science of The Total Environment609:896‑905. https://doi.org/10.1016/j.scitotenv.2017.07.066
- Assessment and valuation of recreational ecosystem services of landscapes.Ecosystem Services31:289‑295. https://doi.org/10.1016/j.ecoser.2018.04.011
- Applying Ecosystem Services Approaches for Biodiversity Conservation: Benefits and Challenges.S.A.P.I.EN.S5(1). [InEnglish].
- ‘The Matrix Reloaded’: A review of expert knowledge use for mapping ecosystem services.Ecological Modelling295:21‑30. https://doi.org/10.1016/j.ecolmodel.2014.08.024
- Jakeman A, Sawah SE, Guillaume JA, Pierce S (2011) Making Progress in Integrated Modelling and Environmental Decision Support. IFIP Advances in Information and Communication Technology. https://doi.org/10.1007/978-3-642-22285-6_2
- Socioeconomic Impacts of Protection Status on Residents of National Parks.European Countryside8(2). https://doi.org/10.1515/euco-2016-0006
- Soil as a filter for groundwater quality.Current Opinion in Environmental Sustainability4(5):507‑516. https://doi.org/10.1016/j.cosust.2012.10.007
- Ecosystem services visualization and communication: A demand analysis approach for designing information and conceptualizing decision support systems.Ecosystem Services13:173‑183. https://doi.org/10.1016/j.ecoser.2015.02.006
- Endangered settlements and protected areas in Estonia: the challenge of maintaining cultural landscapes.International Journal of Agricultural Resources, Governance and Ecology11:346. https://doi.org/10.1504/ijarge.2015.074094
- Plant functional assemblages as indicators of the resilience of grassland ecosystem service provision.Ecological Indicators73:118‑127. https://doi.org/10.1016/j.ecolind.2016.09.024
- A multi-criteria approach for an integrated land-cover-based assessment of ecosystem services provision to support landscape planning.Ecological Indicators21:54‑66. https://doi.org/10.1016/j.ecolind.2011.12.010
- Stakeholder perceptions of grassland ecosystem services in relation to knowledge on soil fertility and biodiversity.Regional Environmental Change11(4):791‑804. https://doi.org/10.1007/s10113-011-0214-0
- Urban ecosystem services assessment along a rural–urban gradient: A cross-analysis of European cities.Ecological Indicators29:179‑190. https://doi.org/10.1016/j.ecolind.2012.12.022
- Using plant functional traits to understand the landscape distribution of multiple ecosystem services.Journal of Ecology99(1):135‑147. https://doi.org/10.1111/j.1365-2745.2010.01753.x
- Analysing Data of the Integrated Administration and Control System (IACS) to Detect Patterns of Agricultural Land-Use Change at Municipality Level.Landscape Online1‑24. https://doi.org/10.3097/lo.201648
- A European assessment of the provision of ecosystem services. Towards an atlas of ecosystem services.JRC-IES
- Mapping ecosystem services across scales and continents – A review.Ecosystem Services13:57‑63. https://doi.org/10.1016/j.ecoser.2015.01.006
- A novel deliberative multicriteria evaluation approach to ecosystem service valuation.Ecology and Society22(2). https://doi.org/10.5751/es-09105-220239
- Understanding the Use of Ecosystem Service Knowledge in Decision Making: Lessons from International Experiences of Spatial Planning.Environment and Planning C: Government and Policy32(2):320‑340. https://doi.org/10.1068/c12292j
- An interdisciplinary methodological guide for quantifying associations between ecosystem services.Global Environmental Change28:298‑308. https://doi.org/10.1016/j.gloenvcha.2014.07.012
- The impact of economic, social and political factors on the landscape structure of the Vidzeme Uplands in Latvia.Landscape and Urban Planning70:57‑67. https://doi.org/10.1016/j.landurbplan.2003.10.005
- The influence of European Union single area payments and less favoured area payments on the Latvian landscape.European Countryside2(1). https://doi.org/10.2478/v10091-010-0003-7
- Ecosystem Service capacity is higher in areas of multiple designation types.One Ecosystem2:e13718. https://doi.org/10.3897/oneeco.2.e13718
- Semi-natural grasslands as population sources for pollinating insects in agricultural landscapes.Journal of Applied Ecology44(1):50‑59. https://doi.org/10.1111/j.1365-2664.2006.01250.x
- Practical solutions for bottlenecks in ecosystem services mapping.One Ecosystem3:e20713. https://doi.org/10.3897/oneeco.3.e20713
- Deliberative Multicriteria Evaluation.Environment and Planning C: Government and Policy24(2):169‑190. https://doi.org/10.1068/c22s
- National ecosystem services mapping at multiple scales ⿿ The German exemplar.Ecological Indicators70:357‑372. https://doi.org/10.1016/j.ecolind.2016.05.043
- Soil structure as an indicator of soil functions: A review.Geoderma314:122‑137. https://doi.org/10.1016/j.geoderma.2017.11.009
- Distribution of the Green Network of Estonia.Forestry Studies / Metsanduslikud Uurimused53https://doi.org/10.2478/v10132-011-0090-x
- Ecosystem service bundles for analyzing tradeoffs in diverse landscapes.Proceedings of the National Academy of Sciences107(11):5242‑5247. https://doi.org/10.1073/pnas.0907284107
- Process matters: a framework for conducting decision-relevant assessments of ecosystem services.International Journal of Biodiversity Science, Ecosystem Services & Management11(3):190‑204. https://doi.org/10.1080/21513732.2014.966149
- Rūsiņa S (2017) Semi-natural grasslands in Latvia. In: Rūsiņa S (Ed.) Outstanding semi-natural grassland sites in Latvia: biodiversity, managment, restoration.University of Latvia,Riga.
- The perception of abandoned farmland by local people and experts: Landscape value and perspectives on future land use.Landscape and Urban Planning115:49‑61. https://doi.org/10.1016/j.landurbplan.2013.03.012
- Analysis of the policies and regulatory framework influencing maintenance of grassland ecosystems in the Baltic States: Synthesis Report. LIFE Viva Grass. Baltic Environmental Forum. http://vivagrass.eu/wp-content/uploads/2017/03/7-2-5_policy-assessment_syntesis-report_october2016_final.pdf. Accessed on: 2018-2-21.
- Creating an operational database for Ecosystems Services Mapping and Assessment Methods.One Ecosystem3:e26719. https://doi.org/10.3897/oneeco.3.e26719
- Millennium ecosystem assessment. Ecosystems and human well-being: Synthesis.Island Press,Washington, DC.
- Mapping ecosystem services' values: Current practice and future prospects.Ecosystem Services4:33‑46. https://doi.org/10.1016/j.ecoser.2013.02.003
- A review of the distribution coefficients of trace elements in soils: influence of sorption system, element characteristics, and soil colloidal properties.Advances in colloid and interface science201-202:43‑56. https://doi.org/10.1016/j.cis.2013.10.005
- How natural capital delivers ecosystem services: A typology derived from a systematic review.Ecosystem Services26:111‑126. https://doi.org/10.1016/j.ecoser.2017.06.006
- Soukup T, Feranec J, Hazeu G, Jaffrain G, Jindrova M, Kopecky M, Orlitova E (2016) Chapter 11 CORINE Land Cover 2000 (CLC2000): Analysis and Assessment. European Landscape Dynamics. https://doi.org/10.1201/9781315372860-12
- Unpacking ecosystem service bundles: Towards predictive mapping of synergies and trade-offs between ecosystem services.Global Environmental Change47:37‑50. https://doi.org/10.1016/j.gloenvcha.2017.08.004
- Recreational cultural ecosystem services: How do people describe the value?Ecosystem Services26:1‑9. https://doi.org/10.1016/j.ecoser.2017.05.010
- Analysis, participation and power: justification and closure in participatory multi-criteria analysis.Land Use Policy23(1):95‑107. https://doi.org/10.1016/j.landusepol.2004.08.010
- Marginal lands in Europe—causes of decline.Basic and Applied Ecology6(2):99‑106. https://doi.org/10.1016/j.baae.2005.01.001
- The Economics of Ecosystems and Biodiversity: Mainstreaming the Economics of Nature: A Synthesis of the Approach, Conclusions and Recommendations of TEEB.TEEB
- Landscape perspectives on agricultural intensification and biodiversity – ecosystem service management.Ecology Letters8(8):857‑874. https://doi.org/10.1111/j.1461-0248.2005.00782.x
- Spatial quantification and valuation of cultural ecosystem services in an agricultural landscape.Ecological Indicators37:163‑174. https://doi.org/10.1016/j.ecolind.2012.06.025
- Updated common bio-physical criteria to define natural constraints for agriculture in Europe.Joint Research Centre, Publications Office of the European Union,Luxembourg. [InEnglish]. https://doi.org/10.2788/91182
- From USSR to EU: 20 years of rural landscape changes in Vidzeme, Latvia.Landscape and Urban Planning105(3):241‑249. https://doi.org/10.1016/j.landurbplan.2011.12.009
- Preferences for European agrarian landscapes: A meta-analysis of case studies.Landscape and Urban Planning132:89‑101. https://doi.org/10.1016/j.landurbplan.2014.08.012
- A comparative approach to assess the contribution of landscape features to aesthetic and recreational values in agricultural landscapes.Ecosystem Services17:87‑98. https://doi.org/10.1016/j.ecoser.2015.11.011
- Proceedings of the 19th Conference for Junior researchers "Science-Future of Lithuania: Environmental Protection Engineering".Proceedings of the 19th Conference for Junior Researchers „Science – Future of Lithuania“https://doi.org/10.3846/aainz.2016.31
- Assessment of site-specific drivers of farmland abandonment in mosaic-type landscapes: A case study in Vidzeme, Latvia.Agriculture, Ecosystems & Environment253:113‑121. https://doi.org/10.1016/j.agee.2017.10.016
- Walz U, Syrbe R, Grunewald K (2017) Where to map? In: Burkhard B, Maes J (Eds) Mapping Ecosystem Services.Pensoft Publishers,Sofia, Bulgaria,374pp. [InEnglish].
- Are ecosystem service studies presenting the right information for decision making?Ecosystem Services25:128‑139. https://doi.org/10.1016/j.ecoser.2017.03.002
- Towards (dis)continuity of agricultural wetlands: Latvia’s polder landscapes after Soviet productivism.Landscape Research1‑15. https://doi.org/10.1080/01426397.2017.1316367
- Response of ecosystem services to socioeconomic development in the Yangtze River Basin, China.Ecological Indicators72:481‑493. https://doi.org/10.1016/j.ecolind.2016.08.035