|
One Ecosystem :
Methods
|
|
Corresponding author: Dirk Lauwaet (dirk.lauwaet@vito.be)
Academic editor: Davide Geneletti
Received: 07 Mar 2018 | Accepted: 07 Aug 2018 | Published: 20 Aug 2018
© 2018 Dirk Lauwaet, Ton De Nijs, Inge Liekens , Hans Hooyberghs, Els Verachtert, Wouter Lefebvre, Koen De Ridder, Roy Remme, Steven Broekx
This is an open access article distributed under the terms of the Creative Commons Attribution License (CC BY 4.0), which permits unrestricted use, distribution, and reproduction in any medium, provided the original author and source are credited.
Citation:
Lauwaet D, De Nijs T, Liekens I, Hooyberghs H, Verachtert E, Lefebvre W, De Ridder K, Remme R, Broekx S (2018) A new method for fine-scale assessments of the average urban Heat island over large areas and the effectiveness of nature-based solutions. One Ecosystem 3: e24880. https://doi.org/10.3897/oneeco.3.e24880
|
|
Abstract
People living in cities experience extra heat stress due to the so-called Urban Heat Island (UHI) effect. To gain an insight into the spatial variability of the UHI for the Netherlands, a detailed map (10 m horizontal resolution) has been calculated that shows the summer-averaged daily maximal UHI situation. The map is based on a relationship between the UHI, mean wind speed at 10 m height and the number of people living within a distance of 10 km, derived from simulations of over 100 European cities with the extensively validated urban climate model UrbClim. The cooling effect of green and blue infrastructure is also taken into account in the map, based on these simulation results. The presented map will help local authorities in defining target areas for climate adaptation measures and estimate the impact of nature-based solutions.
Keywords
Urban Heat Island, Netherlands, nature-based solutions, UrbClim model, Ecosystem services mapping
Introduction
High population density and rapid urban growth increase the vulnerability of cities to extreme weather (
In this context, nature-based solutions as urban greenery and water features have been proposed as an effective measure to mitigate the UHI and improve the urban microclimate (
Since climate change will further increase the risks of morbidity and mortality in urban areas due to greater frequency of weather extremes, there is increasing interest for detailed maps of the UHI effect covering large areas (regions or countries). To accomplish this, two types of methodologies are currently used. The first type of models use empirically derived relationships between land use/vegetation indices and the UHI (e.g.
In this paper, we present a GIS-based methodology that combines both the advantages of physically based model results with the fast and simple regression methodology to deliver a very high resolution (10 m) daily maximal UHI map in which the effectiveness of existing green and blue infrastructure can be assessed for all locations.
Methodology
The methodology is based on a large ensemble of physically based model simulations of 100 cities and their surroundings all over Europe. These simulations have been performed with the urban boundary layer climate model UrbClim (
A statistical analysis of the simulation results revealed that the summer (June-August) average daily maximal UHI value of a given city can be estimated based on only two explanatory variables: the mean wind speed at 10 m height (wind10m) and the total number of people living within a radius of 10 km (population10km) (Fig.
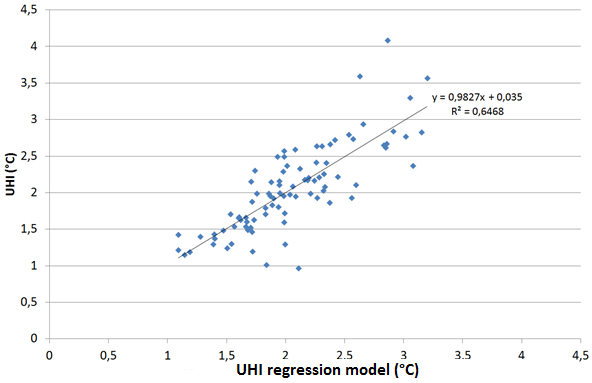
The resulting regression is as follows:
Daily maximal UHI = -1.605 + 1.062 * log(x) - 0.356 * y
with
x is the total number of people living within a radius of 10 km
y is the mean wind speed at 10 m height
the lower boundary set to 0.
Subsequently, detailed land use and soil sealing maps are used to calculate the local daily maximal UHI value. UHI values are only assigned to a pixel when there are sealed surfaces in the neighbourhood. Since data analysis showed that the maximum UHI value of a city is only reached in pixels that are surrounded by large sealed areas, we scale the daily maximal UHI value of a location by multiplying it by the average soil sealing % of all the grid cells (10 m x 10 m) in a 1 km radius. In this way, we introduce realistic local variations of the UHI within a city.
Finally, we take the cooling effect of neighbouring green/blue areas into account based on the average UHI reduction effect for all non-urban types of land uses (assigned to a limited amount of categories) from the model simulations of the 100 European cities (Table
Results and discussion
The methodology described above is used to calculate the summer-average daily maximal UHI map for the entire Netherlands at a spatial resolution of 10 m (Fig.
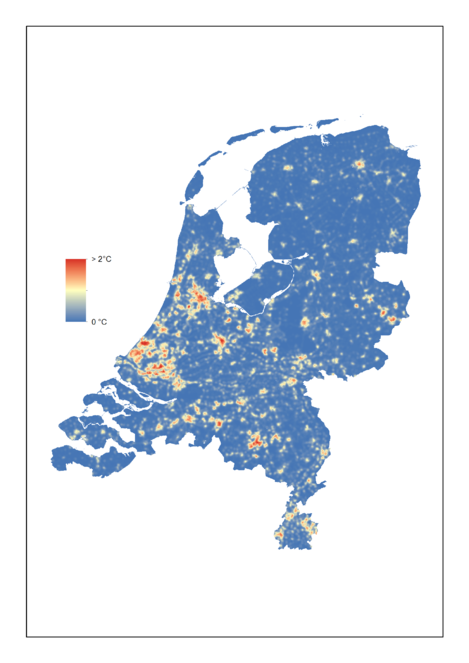
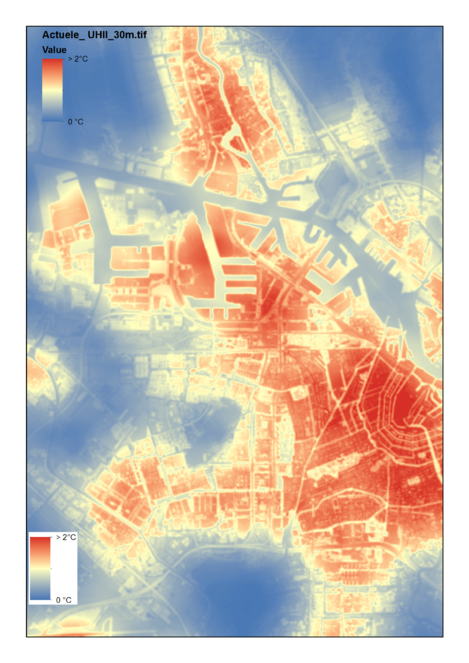
This map shows only the average UHI situation in a region, which can look drastically different for real-time situations (e.g. during heat waves, the UHI effect is typically much larger). Another drawback of the methodology is that it is only suited for populated areas. Remote industrial complexes where no-one is living, which are known to produce a large UHI effect, will not appear on the map. In addition, since the Netherlands is very flat, we did not take terrain effects into account in our methodology in order to keep it simple. These should certainly be included when working in more accidental areas, which is easy to do.
Comparing our methodology to existing literature and reported case studies is not straightforward, since it is based on a very large and unique dataset of high-resolution urban climate simulations of 100 cities over a full summer period. Related studies are mainly based on either measurements on a few locations and/or for short time periods (e.g.
Taking all this into account, we believe our methodology is suited to deliver a good first-order estimate of the local UHI situation and the effect of green/blue infrastructure over large areas.
Conclusion
In this paper, a GIS-based methodology is presented to calculate very high resolution (10 m) maps for the average urban heat island situation in large regions, taking the cooling effect of green/blue infrastructure into account. The method is based on a large dataset of urban climate simulations for cities all over Europe and needs only 4 input maps: population density, mean wind speeds at 10 m height, soil sealing and land use. When mapping areas with a lot of topographical variation, the terrain height effect should also be included. The methodology is applicable for all locations in Europe and delivers a detailed first-order estimate of the average UHI situation in a region, given the listed limitations.
Grant title
ESMERALDA: Enhancing ecoSysteM sERvices mApping for poLicy and Decision mAking. Project ID: 642007 Funded under: H2020-EU.3.5.2. - Protection of the environment, sustainable management of natural resources, water, biodiversity and ecosystems
References
- Urban greening to cool towns and cities: A systematic review of the empirical evidence.Landscape and Urban Planning97:147‑55. https://doi.org/10.1016/j.landurbplan.2010.05.006
- Field measurements on microclimate in residential community in Guangzhou, China.Frontiers of Architecture and Civil Engineering in China3(4):462‑468. https://doi.org/10.1007/s11709-009-0066-6
- Watering our cities: The capacity for Water Sensitive Urban Design to support urban cooling and improve human thermal comfort in the Australian context.Progress in Physical Geography37(1):2‑28. https://doi.org/10.1177/0309133312461032
- Mitigating and adapting to climate change: Multi-functional and multi-scale assessment of green urban infrastructure.Journal of Environmental Management146:107‑115. https://doi.org/10.1016/j.jenvman.2014.07.025
- UrbClim - a fast urban boundary layer climate model.Urban Climate12:21‑48. https://doi.org/10.1016/j.uclim.2015.01.001
- Urban and rural mortality rates during heat waves in Berlin and.Environmental Pollution159:2044‑2050. https://doi.org/10.1016/j.envpol.2011.01.016
- Advantages of using a fast urban boundary layer model as compared to a full mesoscale model to simulate the urban heat island of Barcelona.Geoscientific Model Development9:4439‑4450. https://doi.org/10.5194/gmd-9-4439-2016
- Review on the impact of urban geometry and pedestrian level greening on outdoor thermal comfort.Renewable and Sustainable Energy Reviews54:1002‑1017. https://doi.org/10.1016/j.rser.2015.10.104
- Detailed Urban Heat Island projections for cities worldwide: dynamical downscaling CMIP5 global climate models.Climate3:391‑415. https://doi.org/10.3390/cli3020391
- Assessing the current and future urban heat island of Brussels.Urban Climate15:1‑15. https://doi.org/10.1016/j.uclim.2015.11.008
- A modification to the NOAH LSM to simulate heat mitigation strategies in the New York City Metropolitan Area.Journal of Applied Meteorology and Climatology48:199‑216. https://doi.org/10.1175/2008JAMC1774.1
- Water facilities for creation of comfortable urban micrometeorology.Solar Energy64(4):197‑207.
- Simulation of surface urban heat islands under ‘‘ideal’’ conditions at night. Part 2: Diagnosis of causation.Boundary Layer Meteorology56:339‑358. https://doi.org/10.1007/BF00119211
- ARC3.2 Summary for City Leaders.Urban Climate Change Research Network.Columbia University,New York
- Modelling the fine-scale spatiotemporal pattern of urban heat island effect using land use regression approach in a megacity.Science of The Total Environment618:891‑904. https://doi.org/10.1016/j.scitotenv.2017.08.252
- The thermal regime of urban parks in two cities with different summer climates.International Journal of Remote Sensing19(11):2085‑2104. https://doi.org/10.1080/014311698214884
- Urban tree design approaches for mitigating daytime urban heat island effects in a high-density urban environment.Energy and Buildings114:265‑274. https://doi.org/10.1016/j.enbuild.2015.06.031
- Temporal and spatial variability of urban heat island and thermal comfort within the Rotterdam agglomeration.Build. Environ83:91‑103. https://doi.org/10.1016/j.buildenv.2014.08.029
- The diurnal evolution of the urban heat island of Paris: a model-based case study during Summer.Atmos. Chem. Phys13:8525‑8541. https://doi.org/10.5194/acp-13-8525-2013