|
One Ecosystem :
Research Article
|
|
Corresponding author: Mario V Balzan (mario.balzan@mcast.edu.mt)
Academic editor: Davide Geneletti
Received: 15 Feb 2018 | Accepted: 31 May 2018 | Published: 05 Jun 2018
© 2018 Mario V Balzan, Iain Debono
This is an open access article distributed under the terms of the Creative Commons Attribution License (CC BY 4.0), which permits unrestricted use, distribution, and reproduction in any medium, provided the original author and source are credited.
Citation:
Balzan MV, Debono I (2018) Assessing urban recreation ecosystem services through the use of geocache visitation and preference data: a case-study from an urbanised island environment. One Ecosystem 3: e24490. https://doi.org/10.3897/oneeco.3.e24490
|
|
Abstract
Recreation is an important cultural ecosystem service and is one way in which communities experience the direct and indirect benefits arising from the experiential use of their environment. The recent rise in popularity of Global Positioning System (GPS) game applications, which combine information technology with an activity that increases mobility and encourages outdoor enjoyment, provides ecosystem service practitioners with an opportunity to make use of this georeferenced data to assess recreational ecosystem services. Geocaching is one such worldwide outdoor game. It has fixed points of incursion where people can hide and look for caches. This study explores the possibility of using geocaching data as a proxy for recreational ecosystems services in the Maltese Islands. A quantitative analysis of the georeferenced caches was used together with their visit rates and number of favourite points. This was supplemented by two questionnaires that investigated the preferences and experiences of both geocache placers (n=39) and hunters (n=21). Results show that the highest number of caches were placed and searched for in urban areas and that geocaching is strongly associated with the presence and accessibility of urban green infrastructure. The number of geocachers who stated preference for experiences in nature did not translate into high visit rates to sites of high conservation value (protected areas) but landscape value was significantly associated with recreational ecosystem services flow. The results presented here provide evidence that geocaching spatial data can act as an indicator for assessing and mapping recreational ecosystem services in urban environments and in cultural landscapes.
Keywords
Cultural Ecosystem Services; Ecosystem Service Capacity; Ecosystem Service Flow; Global Positioning System; Green Infrastructure; Urban Ecosystem Service
Introduction
The assessment and mapping of ecosystems and their services is a commitment of the European Union (EU) member states under Action 5 of the EU Biodiversity Strategy to 2020. Activities carried out under this commitment should support the maintenance and restoration of ecosystems and their services in order to ensure human well-being. This statement is supported by recent work at pan-European scale, which has shown that ecosystems in favourable conditions support biodiversity and have a higher capacity to supply ecosystem services and, in particular, regulating and cultural services, in comparison to habitats in unfavourable conditions (
Cultural ecosystem services are defined in the Common International Classification of Ecosystem Services (CICES) as all the non-material and normally non-consumptive, ecosystem outputs that affect physical and mental states of people (
The recent phenomenon of social media and the availability of tools to geotag recreational activities has created a number of possibilities to use such data to analyse the benefits and values derived from cultural ecosystem services. Amongst others, several recent studies have assessed site visitation for recreation and tourism using geotagged photos and site visitation records such as from Flickr*
Geocaching is an example of a GPS-based outdoor game. It has been available since the year 2000 and is today described on its website as the world’s largest treasure hunt. Geocaching has fixed incursion sites spread over a variety of terrestrial and coastal ecosystems. It has more than 3 million active geocaches in 191 different countries across the 7 continents, more than 360,000 geocache owners and 585 million "Found it" and "Event Attended" logs have been recorded since the game started*
This national case-study assesses the use of Geocaching data to assess recreational ecosystem service delivery in the small island state of Malta. More specifically, the objectives of the study are to assess:
- the influence of the ecosystem type, distribution and accessibility on recreational ecosystem services delivery and
- on the actual use (flow) of this ecosystem service measured using both geocache visitation data and questionnaires with geocachers that allow for a better understanding of their motivation for determining ecosystem service flow.
Material and methods
Conceptual approach
In order to implement the concept of ecosystem services, various frameworks distinguish between the different components of ecosystem delivery (
Within this study, we use geocaching data as a proxy for recreational ecosystem services in a multifunctional landscape (Table
Explanation of geocaching terms (based on descriptions in http://www.geocaching.com and
|
Term |
Explanation |
|
Quest |
Total number of people who either found or did not find the cache. |
|
Favourite points |
For every ten geocaches that a cacher with a premium account has found, he/she will be able to identify his/her favourite in one exceptional geocache in his/her find history. |
|
Geocache hunter |
Geocaching user who has logged caches within the study area. |
|
Geocache placer |
Geocache owners who placed their geocache within the study area and who retains all responsibility for geocache listing and care. |
|
Traditional Geocache |
This is the original type of geocache consisting of a container at the given coordinates. As a minimum, all of the geocaches will have a logbook. |
|
Mystery cache |
This type of geocache may involve complicated puzzles that one will first need to solve to determine the correct coordinates. |
|
Multi-cache |
These geocaches involve two or more locations, with the final location being a physical container with a logbook inside. At the first stage, the geocache hunter will receive a clue to the whereabouts of the second stage. The second stage will have a clue for the third and so on. |
|
EarthCache |
An EarthCache is a special geological location people can visit to learn about a unique feature of the Earth. EarthCache pages include a set of educational notes along with coordinates. |
|
Letterbox Hybrid |
Letterboxing is another form of treasure hunting that uses clues instead of coordinates. These types of geocaches will contain a stamp that is meant to remain in the box and is used by letterboxers to record their visit. |
|
Wherigo™ Cache |
Wherigo is a toolset for creating and playing GPS-enabled adventures in the real world. By integrating a Wherigo experience, called a cartridge, with finding a geocache, the geocaching hunt can be an even richer experience. Amongst other uses, Wherigo allows geocachers to interact with physical and virtual elements such as objects or characters while still finding a physical geocache container. |
Within this study, we have adapted the methodology used by
Study Area
The island state of Malta is situated in the Central Mediterranean Sea at 96 km south of Sicily and almost 300 km east of Tunisia. With a surface area of around 316 km2, the archipelago consists of three inhabited islands (Malta, Gozo and Comino) and several uninhabited islets. The first evidence of human settlement in Malta dates back to around 7000 BP (
Recent research within the area of study has indicated the important role of ecosystems for the delivery of the key ecosystem services and that semi-natural and agricultural habitats are associated with a high ecosystem service capacity within this island environment. However, the actual use of ecosystem services (flow) was higher in small green urban and peri-urban areas. Coastal habitats were associated with cultural ecosystem services, in the form of habitats of conservation value (ecosystem service capacity) and aesthetic value (ecosystem service flow), but green urban areas and urban environments were also identified by survey respondents as having a high aesthetic value and for the provision of recreational ecosystem services (
Data Collection
Spatial analysis of ecosystem service capacity and flow
Data for geocaching activities in Malta were obtained from the Groundspeak, Inc. Geocaching platform on 14 February 2017. For this study, we focused on caches which had been placed for more than 100 days and that have accessible geographic coordinates. We obtained information on the name, location (latitude/longitude), geocache type, date of placement, number of favourite points and number of quests. This information provided us with quantitative data on the availability (ES capacity) and the actual use (ES flow) of ecosystems through this recreational outdoor activity. The average number of quests and favourites per year in each geocache location was then calculated.
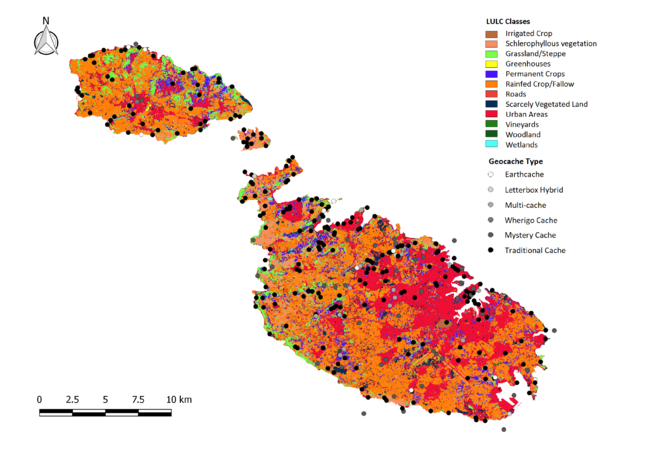
Information about the land use and cover of each geocache was obtained from a land use land cover (LULC) map that consists of 13 LULC categories (
Understanding geocacher motivations determining ecosystem service flow
In order to obtain information on the preferences of geocachers, two sets of questionnaires, one for the geocache hunters (Appendix 1, Suppl. material
Data Analysis
The influence of land cover and geocache type on the number of quests and favourite points was assessed through the use of a generalised linear model (GLM) with a negative binomial distribution due to the overdispersion of the count geocache data. The time since the placement of the geocache was included as an offset vector in order to account for different levels of visitation arising from the variation in time since the geocache was set up (
All spatial operations and statistical analysis were carried out using R language and environment for statistical computing (
Results
Spatial analysis of ecosystem service capacity and flow
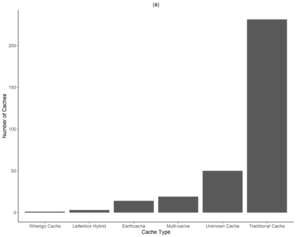
A total of 318 geocaches from the study area were investigated in this study (Fig.
Parameter estimates using GLM with a negative binomial distribution for the number of quests and favourite points when compared to the Urban LULC are shown. The most parsimonious model (lowest Akaike Information Criterion with a second order correction, AICc) for each response variable was selected as the best model. *0.01<P<0.05, **0.001<P<0.01, ***P<0.001; P values obtained from Wald test statistic (Z) for each parameter.
|
Number of Quests |
Favourite points |
|||
|
Est (±SE) |
Z |
Est (±SE) |
Z |
|
|
Intercept |
4.88 (0.21) |
23.62*** |
2.51 (0.29) |
8.66*** |
|
Marine |
-0.60 (0.16) |
-3.66*** |
0.58 (0.23) |
2.47* |
|
Arable |
-0.69 (0.12) |
-5.75*** |
-0.28 (0.17) |
-1.61 |
|
Garrigue |
-0.66 (0.19) |
-3.44*** |
-0.001 (0.28) |
-0.002 |
|
Grassland |
-0.87 (0.14) |
-6.10*** |
-0.04 (0.20) |
-0.19 |
|
Orchard |
-0.57 (0.14) |
-4.03*** |
-0.60 (0.21) |
-2.88** |
|
Sparsely vegetated land |
-0.30 (0.18) |
-1.63 |
0.14 (0.26) |
0.55 |
|
Woodland |
-0.70 (0.34) |
-2.04* |
0.39 (0.49) |
0.81 |
|
Letterbox Hybrid |
0.08 (0.48) |
0.17 |
0.06 (0.67) |
0.083 |
|
Multi-cache |
-0.39 (0.27) |
-1.47 |
-0.28 (0.38) |
-0.76 |
|
Traditional Cache |
0.17 (0.21) |
0.80 |
-1.14 (0.29) |
-3.88*** |
|
Mystery cache |
-0.73 (0.23) |
-3.24** |
-0.83 (0.32) |
-2.60** |
|
Wherigo cache |
-1.89 (0.78) |
-2.44 |
-0.66 (1.08) |
-0.61 |
|
df |
289 |
289 |
||
|
AICc |
4171.08 |
2373.13 |
||
|
ΔAICc |
22.56 |
7.86 |
||
Association of the geocaching number of quests and favourite points from the study area with the reclassified Urban Atlas categories, obtained from GLMM with a negative binomial error distribution and using the number of years from geocache placement as an offset in the analysis and geocache type as a random variable. Estimated parameters (Est) and Wald test values (Z) from the GLMM, when compared to the Urban - High Density category, are shown. $0.05<P<0.1, *0.01<P<0.05, **0.001<P<0.01, ***P<0.001; P values obtained from Wald z-statistics for each parameter.
|
Number of Quests |
Favourite points |
|||
|
Est (±SE) |
Z |
Est (±SE) |
Z |
|
|
Intercept |
4.74 (0.27) |
17.57*** |
1.91 (0.39) |
4.91*** |
|
Urban – Low Density |
-0.59 (0.28) |
-2.07* |
-0.08 (0.43) |
-0.19 |
|
Industrial |
0.10 (0.23) |
0.68 |
0.34 (0.35) |
0.97 |
|
Roads |
-0.40 (0.23) |
-1.78$ |
-0.41 (0.34) |
-1.20 |
|
Airport and ports |
-0.54 (0.39) |
-1.39 |
-0.33 (0.57) |
-0.58 |
|
Mines and construction |
-0.13 (0.47) |
-0.28 |
-1.61 (0.82) |
-1.94$ |
|
Green urban & leisure areas |
0.05 (0.28) |
0.18 |
0.82 (0.42) |
1.96$ |
|
Agriculture |
-0.81 (0.20) |
-4.00*** |
0.089 (0.31) |
0.29 |
|
Forests |
-0.63 (0.79) |
-0.81 |
-0.76 (1.15) |
-0.66 |
|
Water |
-0.69 (0.47) |
-1.47 |
-0.16 (0.69) |
-0.23 |
|
Marine |
-0.66 (0.25) |
-2.63*** |
0.50 (0.37) |
1.35 |
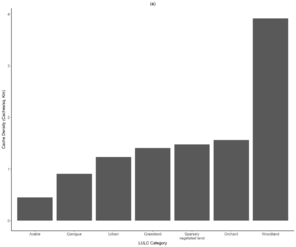
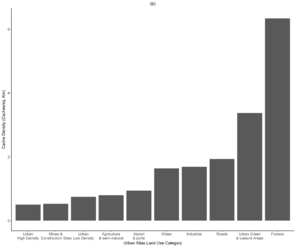
Relationship between cache density and the land use and land cover when using (a) a land use land cover (LULC) map generated using Sentinel 2 satellite images and (b) the EEA urban atlas land uses for the study area.
b: Relationship between cache density and the land use and land cover when using the EEA urban atlas land uses for the study area.
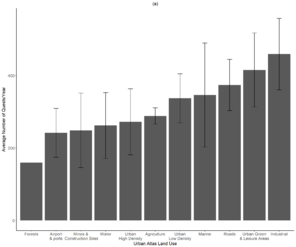
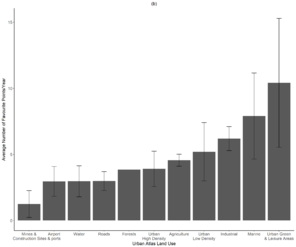
Mean number of (a) quests and (b) favourite points (± standard error of the mean) for the reclassified Urban Atlas land use categories
b: Mean number of favourite points (± standard error of the mean) for the reclassified Urban Atlas land use categories
In order to assess the contribution of gene pool protection ecosystem services in geocaching activities, the influence of sites designation as protected areas on recreational ecosystem services was analysed. Nationally designated areas had a higher geocache density (2.3 caches/km2) in comparison to sites that did not have any designation (0.4 caches/km2). Most of the caches found in designated areas were located in areas of high landscape value and in Special Areas of Conservation and Special Protection Areas (Table 3-1, Appendix 3, Suppl. material
Most caches were located in proximity to residential areas and the road network but distance from public transport network and the coast appears to follow a normal distribution (Appendix 3, Suppl. material
Measuring the relationship between the distance from residential areas, the road and public transport network and coast and the number of quests and favourite points. The difference in deviance between two compared models following backward elimination and its significance using a ꭕ2 test are shown.
|
Spatial data |
df |
Mean distance in metres (±SE) |
Number of Quests |
Number of Favourite Points |
||||
|
ꭕ2 |
p |
Effect |
ꭕ2 |
P |
Effect |
|||
|
Distance to Residential areas (DRe) |
1 |
1118.35 (±51.52) |
0.22 |
0.64 |
5.06 |
0.02 |
+ |
|
|
Distance to road (DRo) |
1 |
126.99 (±8.23) |
17.62 |
<0.0001 |
- |
3.98 |
0.046 |
- |
|
Distance to bus route (DB) |
1 |
5155.02 (±120.14) |
50.7 |
<0.0001 |
- |
9.2 |
0.002 |
- |
|
Distance to coast (Dc) |
1 |
3843.47 (±82.78) |
7.4 |
0.007 |
- |
8.38 |
0.004 |
- |
|
DRe x DB |
1 |
11.76 |
0.0006 |
0.04 |
0.84 |
|||
|
DRe x DRo |
1 |
0.32 |
0.57 |
0.5 |
0.48 |
|||
|
DRe x DC |
1 |
0.86 |
0.35 |
0.20 |
0.65 |
|||
|
DC x DB |
1 |
0.70 |
0.40 |
0.22 |
0.64 |
|||
|
DRo x DC |
1 |
0.00 |
1.00 |
0.62 |
0.43 |
|||
|
DRo x DB |
1 |
3.9 |
0.048 |
0.80 |
0.37 |
|||
|
DRo x DRe x DB |
1 |
2.48 |
0.12 |
0.48 |
0.48 |
|||
|
DRo x DRe x DC |
1 |
0.90 |
0.34 |
0.02 |
0.89 |
|||
|
DC x DRe x DB |
1 |
2.46 |
0.12 |
1.70 |
0.19 |
|||
|
DRo x DC x DB |
1 |
0.94 |
0.33 |
0.32 |
0.57 |
|||
|
DRo x DRe x DB x DC |
1 |
1.06 |
0.30 |
0.00 |
1.00 |
|||
Understanding geocacher motivations determining ecosystem service flow
Geocache hunter questionnaires
A total of 21 responses were obtained for the questionnaire for geocache hunters. Most of the respondents were in the 16 to 29 and 30 to 45 age groups (n=19) and the majority had a tertiary level (10) of education (Appendix 4, Suppl. material
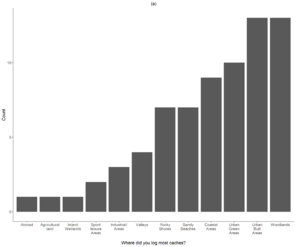
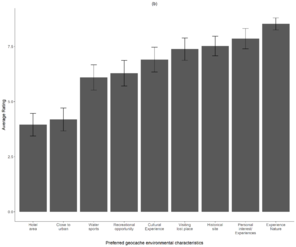
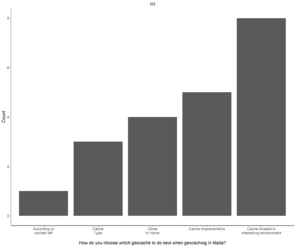
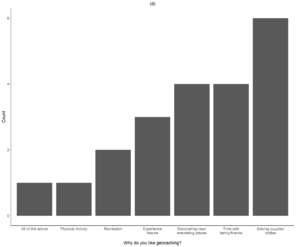
Geocache hunter questionnaire responses according to the (a) environment where they have logged most geocaches, (b) preferred geocache environmental characteristics, (c) reason why they enjoy geocaching and (d) the main factor considered when choosing a geocache.
b: Geocache hunter questionnaire responses according to the preferred geocache environmental characteristics.
c: Geocache hunter questionnaire responses according to the reason for enjoying geocaching.
d: Geocache hunter questionnaire responses according to the main factor considered when geocaching.
Geocache placer questionnaires
A total of 39 responses were obtained for the geocache placer questionnaires. Most had a tertiary level of education (n=36, Appendix 5, Suppl. material
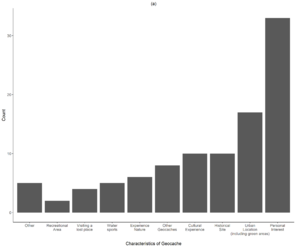
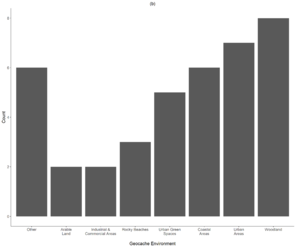
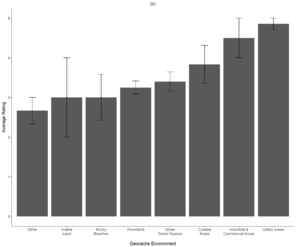
Figure 6 – Geocache placer questionnaire responses according to the (a) characteristics of the geocache, (b) the environment where the geocache was placed and (c) the average rating for the experience assigned to the geocache by the placer.
b: Geocache placer questionnaire responses according to the environment where the geocache was placed.
c: Geocache placer questionnaire responses according to the average rating for the experience assigned to the geocache by the placer.
Discussion
Spatial variation in ecosystem services capacity and flow
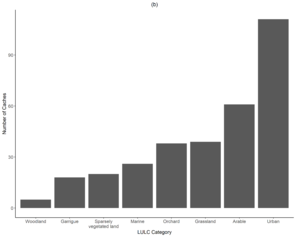
The analysis of geocaching data demonstrates that most geocaches were located in, or in close proximity to, urban land cover. However, the highest geocache density was not recorded in the urban land cover but in semi-natural categories and in urban green and sports and leisure areas, indicating that these environments have a higher capacity to deliver recreational ecosystem services to urban communities, as measured through the use of geocaching data. Accessibility to semi-natural and urban green areas appears to be a particularly important characteristic influencing the capacity of recreational ecosystem services and most of the geocaches were located in close proximity to residential areas and the road network. Similarly, recreational ecosystem services flow data also appear to be strongly linked to the accessibility of the environment. This was also confirmed from questionnaire data for geocache placers, where proximity to work or residence areas was considered as being important for the respondents and these also explained that their geocaches were placed in sites considered as being of personal interest or in urban green areas.
Results presented here are supported by those in
Similar to other studies investigating recreational ecosystem services (
This study contrasts with previous observations from the study area highlighting the importance of semi-natural habitats for aesthetic (cultural) ecosystem services (
The strong positive association of recreational ecosystem services with landscape value demonstrates that processes which essentially degrade the landscape are also likely to have a negative impact on the capacity and flow of this service. This is particularly important in the context of strong urbanisation and tourism development trends within the study area and, in general, within the Mediterranean region, leading to intense pressure on ecosystems as a consequence of land use change. This is exacerbated within the study area as a consequence of the limited land resources available within an insular Mediterranean environment, in particular as traditional management practices decline and are replaced by more intensified management associated with strong tourism and industrial development (
Evidence-based management of urban recreational ecosystem services
Results obtained here demonstrate that the development of an understanding of the spatial variation in availability of green infrastructure and of ecosystem service capacity and flows is critical in order to implement the ecosystem service concept for the development of policies that promote the sustainable use of ecosystem services (
To provide guidance in the choice of appropriate ecosystem service assessment and mapping methods, tiered approaches have been proposed, with tier 1 approaches being dependent on readily available data, tier 2 includes more specific information from the study area whilst tier 3 approaches are more data intensive and are based on an improved understanding of the underpinning processes (
Conclusions
This study has used spatial geocaching data in order to assess the capacity and flow of urban recreational services, whilst also using data generated from questionnaires with geocachers to develop an understanding of the motivations that are likely to influence ecosystem service flows. Geocaching was seen as an opportunity to experience nature, spend time with family and friends and to get physical exercise. Results from the analysis of geocache spatial data indicate that most caches are located in urban land use categories, with the highest cache densities being recorded in green urban areas and semi-natural ecosystems. Ecosystem service flow was positively associated with accessibility of the geocache, areas of high landscape value and proximity to the coastal environment. These results are discussed in further detail as they provide evidence of the importance of developing spatial indicators that rely on an improved understanding of the quantitative and qualitative relationships between ecosystems and ecosystem service capacity and flow, leading to human well-being. Finally, these results provide evidence of relevance for landscape and urban planning which promotes the availability of green infrastructure in urban areas for their important contribution of these to human well-being.
Acknowledgements
Georeferenced data on the geocaches were kindly provided by Groundspeak, Inc. (owner of the largest geocaching site: http://www.geocaching.com). MVB has received funding from the European Union's Horizon 2020 research and innovation programme under grant agreement No 642007 for the “ESMERALDA - Enhancing ecosystem services mapping for policy and decision making” project (http://esmeralda-project.eu/) and also acknowledges research support within the framework of the “EnRoute - Enhancing Resilience Of Urban Ecosystems through Green Infrastructure” project of the European Commission in the framework of the EU Biodiversity Strategy and the Green Infrastructure Strategy to produce this research.
References
- People perception of landscape change effects on ecosystem services in small Mediterranean islands: A combination of subjective and objective assessments.Landsc. Urban Plan112:63‑73. https://doi.org/10.1016/j.landurbplan.2012.12.010
- Assessing the capacity and flow of ecosystem services in multifunctional landscapes : evidence of a rural-urban gradient in a Mediterranean small island state.Land Use Policy75:711‑725. https://doi.org/10.1016/j.landusepol.2017.08.025
- Balzan MV (2017) Ecology for the city : analysing the role of green infrastructure in creating liveable cities. The Fourth Valletta 2018 Annual International Conference - Living Cities, Liveable Spaces: Placemaking & Identity. Valletta 2018: European Capital of Culture.Valletta, Malta.
- Mapping ecosystem service capacity, flow and demand for landscape and urban planning: A case study in the Barcelona metropolitan region.Land use policy57:405‑417. https://doi.org/10.1016/j.landusepol.2016.06.006
- The five pillar EPPS framework for quantifying, mapping and managing ecosystem services.Ecosyst. Serv4:15‑24. https://doi.org/10.1016/j.ecoser.2013.04.003
- Geocaching data as an indicator for recreational ecosystem services in urban areas: Exploring spatial gradients, preferences and motivations.Landsc. Urban Plan144:151‑162. https://doi.org/10.1016/j.landurbplan.2015.08.015
- Contributions of cultural services to the ecosystem services agenda.Proc. Natl. Acad. Sci109:8812‑8819. https://doi.org/10.1073/pnas.1114773109
- de Groot R, Fisher B, Christie M, Aronson J, Braat L, Haines-Young R, Gowdy J, Maltby E, Neuville A, Polasky S, Portela R, Ring I, Blignaut J, Brondizio E, Costanza R, Jax K, Kadekodi GK, May PH, Shmelev S (2010) Integrating the ecological and economic dimensions in biodiversity and ecosystem service valuation. The Economics of Ecosystems and Biodiversity : The Ecological and Economic Foundations.
- Challenges in integrating the concept of ecosystem services and values in landscape planning, management and decision making.Ecol. Complex7:260‑272. https://doi.org/10.1016/j.ecocom.2009.10.006
- Site-specific factors in the production of local urban ecosystem services: A case study of community-managed green space.Ecosyst. Serv17:208‑216. https://doi.org/10.1016/j.ecoser.2016.01.003
- Sentinel- 2: ESA’s Optical High-Resolution Mission for GMES Operational Services.Remote Sens. Environ120:25‑36. https://doi.org/10.1016/j.rse.2011.11.026
- Participatory GIS approaches for mapping ecosystem services, in: Mapping Ecosystem Services.Pensoft Publishers,Sofia.
- Evaluating the aesthetic value of cultural ecosystem services by mapping geo-tagged photographs from social media data on Panoramio and Flickr.J. Environ. Plan. Manag568:1‑16. https://doi.org/10.1080/09640568.2016.1151772
- AD Model Builder: using automatic differentiation for statistical inference of highly parameterized complex nonlinear models.Optim. Methods Softwhttps://doi.org/10.1080/10556788.2011.597854
- A tiered approach for ecosystem services mapping.Mapping Ecosystem Services. Pensoft Publishers, Sofia213‑217.
- A tiered approach for mapping ecosystem services.Ecosyst. Serv13:16‑27. https://doi.org/10.1016/j.ecoser.2014.10.008
- Common International Classification of Ecosystem Services (CICES): Consultation on Version 4, August-December 2012. www.cices.eu. Accessed on: 2017-1-03.
- Social Media Data Can.Conserv. Lett1‑10. https://doi.org/10.1111/conl.12343
- Urban green space availability in European cities.Ecol. Indic70:586‑596. https://doi.org/10.1016/j.ecolind.2016.02.029
- Recreation as an ecosystem service in open landscapes in the Mediterranean region in Israel: Public preferences.Isr. J. Ecol. Evol57:151‑171. https://doi.org/10.1560/IJEE.57.1-2.151
- Urban ecosystem services assessment along a rural-urban gradient: A cross-analysis of European cities.Ecol. Indic29:179‑190. https://doi.org/10.1016/j.ecolind.2012.12.022
- Pathways to bridge the biophysical realism gap in ecosystem services mapping approaches.Ecol. Indic74:241‑260. https://doi.org/10.1016/j.ecolind.2016.11.015
- Ecosystems and Human Well-Being: A Framework for Assessment.Island Press,London.
- Synergies and trade-offs between ecosystem service supply, biodiversity, and habitat conservation status in Europe.Biol. Conserv155:1‑12. https://doi.org/10.1016/j.biocon.2012.06.016
- An indicator framework for assessing ecosystem services in support of the EU Biodiversity Strategy to 2020.Ecosyst. Serv17:14‑23. https://doi.org/10.1016/j.ecoser.2015.10.023
- Mapping and Assessment of Ecosystems and their Services. Urban Ecosystems. Publications Office of the European.Mapping and Assessment of Ecosystems and their Services. Urban Ecosystems. Publications Office of the Europeanhttps://doi.org/10.2779/75203
- M.E.P.A. (2010) The Environment Report 2008 Sub-Report 4 Land. The Environment Report 2008.Malta Environment & Planning Authority,Malta.
- The indicator side of ecosystem services.Ecosyst. Serv1:26‑30. https://doi.org/10.1016/j.ecoser.2012.06.001
- Proceedings of the SIGCHI Conference on Human Factors in Computing Systems.Georgia, Atlanta.Atlanta, Georgia, USA
- Malta in Figures 2014.National Statistics Office,Valletta, Malta.
- Regional Statistics Malta.National Statistics Office,Malta.
- Sustainable multifunctional landscapes: a review to implementation.Current Opinion in Environmental Sustainability2:59‑65. https://doi.org/10.1016/j.cosust.2010.02.005
- Mapping cultural ecosystem services: A framework to assess the potential for outdoor recreation across the EU.Ecological Indicators45:371‑385. https://doi.org/10.1016/j.ecolind.2014.04.018
- ISLANDS IN TIME.Routledge,London. https://doi.org/10.4324/9780203433331
- The use of subjective indicators to assess how natural and social capital support residents’ quality of life in a small volcanic island.Ecological Indicators24:609‑620. https://doi.org/10.1016/j.ecolind.2012.08.021
- Ecosystem services.Progress in Physical Geography35(5):575‑594. https://doi.org/10.1177/0309133311423172
- QGIS Geographic Information System.
- Changes in the value of ecosystem services along a rural–urban gradient: A case study of Greater Manchester, UK.Landscape and Urban Planning109(1):117‑127. https://doi.org/10.1016/j.landurbplan.2012.10.007
- R: A Language and Environment for Statistical Computing.R Foundation for Statistical Computing. Vienna.
- A rapid indicator of cultural ecosystem service usage at a fine spatial scale: Content analysis of social media photographs.Ecol. Indic53:187‑195. https://doi.org/10.1016/j.ecolind.2015.01.034
- The Maltese Islands: climate, vegetation and landscape.GeoJournal41:1‑11. https://doi.org/10.1023/A:1006828706452
- Accounting for capacity and flow of ecosystem services: A conceptual model and a case study for Telemark, Norway.Ecological Indicators36:539‑551. https://doi.org/10.1016/j.ecolind.2013.09.018
- Planning for landscape multifunctionality.Sustain. Sci. Pract. Policy5:45‑52.
-
Generalized Linear Mixed Models using AD Model Builder. R package version 0.7.3.
- A Large-Scale Quantitative Survey of the German Geocaching Community in 2007.Adv. Human-Computer Interact275815.
- Instagram, Flickr, or Twitter: Assessing the usability of social media data for visitor monitoring in protected areas.Scientific Reports7(1). https://doi.org/10.1038/s41598-017-18007-4
- Urban form, biodiversity potential and ecosystem services.Landscape and Urban Planning83(4):308‑317. https://doi.org/10.1016/j.landurbplan.2007.05.003
- Processes and patterns of landscape change on a small Aegean island: The case of Sifnos, Greece.Landscape and Urban Planning99(1):58‑64. https://doi.org/10.1016/j.landurbplan.2010.08.014
- Modern Applied Statistics with S.Statistics and Computinghttps://doi.org/10.1007/978-0-387-21706-2
- Capacity, pressure, demand, and flow: A conceptual framework for analyzing ecosystem service provision and delivery.Ecological Complexity15:114‑121. https://doi.org/10.1016/j.ecocom.2013.07.004
- A multi-indicator framework for mapping cultural ecosystem services: The case of freshwater recreational fishing.Ecological Indicators45:255‑265. https://doi.org/10.1016/j.ecolind.2014.04.001
- Recreation potential assessment at large spatial scales: A method based in the ecosystem services approach and landscape metrics.Ecological Indicators39:34‑43. https://doi.org/10.1016/j.ecolind.2013.11.023
- Importance of recreational ecosystem services in Helsinki, Finland.Management of Environmental Quality: An International Journal24(3):365‑382. https://doi.org/10.1108/14777831311322668