|
One Ecosystem :
Research Article
|
|
Corresponding author: Rositsa Yaneva (r.s.yaneva@gmail.com)
Academic editor: Bilyana Borisova
Received: 20 Dec 2017 | Accepted: 07 Feb 2018 | Published: 21 Feb 2018
© 2018 Rositsa Yaneva, Miglena Zhiyanski, Ivailo Markoff, Maria Sokolovska, Stoyan Nedkov
This is an open access article distributed under the terms of the Creative Commons Attribution License (CC BY 4.0), which permits unrestricted use, distribution, and reproduction in any medium, provided the original author and source are credited.
Citation:
Yaneva R, Zhiyanski M, Markoff I, Sokolovska M, Nedkov S (2018) Assessment and mapping the dynamics of soil properties in selected forest stands from the region of Central Balkan National Park in the context of ecosystem services. One Ecosystem 3: e23156. https://doi.org/10.3897/oneeco.3.e23156
|
|
Abstract
Forests set natural conditions and embody a repository of biological diversity that represents a myriad of ecosystem services for human well-being. The spatial patterns and the forest ecosystems’ dynamics over time make the forests of particular environmental significance for the provision of ecosystem services. The terrestrial biodiversity and the sustainable management strategies' demand for mapping and assessment of the dynamics for the condition of forest ecosystems by drawing attention to the soil properties. In order to take on that task, the data series obtained by the International Co-operative Programme on Assessment and Monitoring of Air Pollution Effects on Forests (ICP Forests) for the period 1986–2016 were found as appropriate quantitative indicators that convey information about the ecosystem’s capacity to provide certain regulating ecosystem services. The ICP Forests Level I sites, located in the Central Balkan region, provide consistent information, which is collected on a regular basis about observed forest stands.
The primary focus of the present research is to conduct a biophysical assessment of the forest ecosystems and to define their overall condition regarding two time series – the periods 1992/1993 and 2015. This study attempts to introduce an innovative approach and aims at linking the existing ICP Forests network dataset with the ecosystem services concept and the identified spatial units from the CORINE Land Cover (CLC) polygons for the territory of Central Balkan National Park. On this basis and through the implementation of GIS techniques, the dynamics of soil properties in selected forest ecosystems was analysed with regard to their capacity to supply relevant ecosystems services, which were assessed and mapped. The biophysical data provides robust information on the ecosystem services and the results show the variations in the capacity of different forest sub-types to provide ecosystem services within a well-defined land cover unit. Additionally, the research work intended to review the generated outcomes with reference to the DPSIR (driver-pressure-state-impact-response) method by giving feedback on the changes in the terrestrial ecosystems in the last 25 years. Further application of the mapping approach in assisting the communication in the decision- making process is also discussed.
Keywords
ICP Forests Level I, soil, dynamics, ecosystem services, mapping
Introduction
Today, the understanding of the dynamics of specific biotic and abiotic properties in forest ecosystems extends to interdisciplinary approaches that provide decision-makers with an effective tool to cope with the effect of environmental disturbances at regional and/or local scales. Likewise, an integrated ecological approach that considers changes in both vegetation and soil should be applied to develop an understanding of how use and management affect the ecosystem functions and the overall forest health status. There is a large body of literature and research on the identification and evaluation of ecosystem goods and services – an approach that is currently gaining more implication in the development of decision support tools that integrate ecological, geographical and socio-economic methods (
The present research focuses on place-base assessment at the scale of forest ecosystems that entails the application of a spatially explicit investigation of service-providing units and the potential of the ecosystem structures and processes to provide specific ecosystem services (
On a European level, the ecosystem services concept is being asserted in the national and regional legislation and there are numbers of policy acts where it has been integrated – e.g. The European Union (EU) Biodiversity Strategy to 2020, The European Commission (EC) Blueprint to safeguard the future of European Waters by 2015. Ecosystem services represent direct and indirect benefits that people obtain from the functioning of the ecosystems (
According to Article 9 of the EU Directive 2016/2284 on the reduction of national emissions of certain atmospheric pollutants, member states are required to reinforce the existing networks of monitoring sites that are representative of their freshwater, natural and semi-natural habitats and forest ecosystem types. In addition, countries shall align the monitoring networks with the analytical framework developed by the EU initiative on Mapping and Assessment of Ecosystems and their Services – MAES (
Most recently, the MAES initiative was set up in Bulgaria through several case studies (
Since 1986, the ICP Forest programme is being implemented in Bulgaria. The monitoring of the state of the forest ecosystems within the ICP Network in Bulgaria is coordinated by the Executive Environment Agency (ExEA), Ministry of Environment and Water (MoEW). Depending on the scale, the National programme for forest ecosystem monitoring is implemented at two levels: Level I - large scale monitoring and Level II - intensive monitoring (
Forest ecosystems play a significant role in climate change, for the regulating functions in the water cycle and for the control of carbon sequestration. There are studies that document the ecological status, dynamics and carbon accumulation in forest vegetation in Bulgaria (
Different data, collected on the basis of harmonised methods, resulted in determination of the dynamics of soil properties and in defining indicators for related ecosystem services. This research aims to map selected regulating ecosystem services in the forest stands of Central Balkan by linking the existing dataset about soil properties obtained from the monitoring networks to the ecosystem services concept.
Materials and methods
Study area and selection of services
The study area is comprised within the Central Balkan National Park and encompasses the mountainous regions of Stara planina. The park partially covers territories of the administrative regions Gabrovo, Lovech, Plovdiv, Sofia and Stara Zagora. The park boundaries enclose the resort of Beklemeto. The region of the Central Balkan National Park Reserves includes, partially or fully, the wildlife sanctuaries Boatin, Dzhendema, Kozya Stena, Peeshti skali, Sokolna, Stara reka, Steneto, Severen Dzhendem and Tsarichina, where 28% of the land is recognised as areas with a strict protection regime.
In landscape-ecological terms, the area is characterised by rich forest biodiversity dominated by broad-leaved forests of Querqus cerris, Querqus frainetto, Fagus sylvatica and mixed forest patches with Pinus sylvestris (
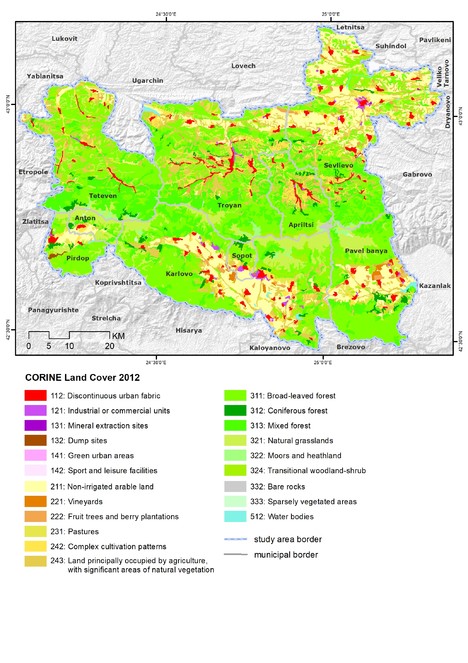
In the studied area of the Central Balkan National Park, forests and natural vegetation cover 51.35% of the territory, where 37.55% is covered with broad-leaved forests; coniferous forest represent 0.69%; mixed forests occupy 6.80%; and natural grasslands – 3.24%. The agricultural activities are mostly developed in the northernmost and lower parts and nearly half of the territory of the study area (47.0% or 556124.00 ha) is used for cultivation of various crops and permanent pastures (Fig.
The main concerns of the study area are related to naturally and anthropogenic-driven hazards triggered by climate change, by natural disasters (avalanches, straight-line winds, fires etc.) and by land intensification. Forestry and agricultural practices confront the demand for habitat restoration and conservation to sustain the overall health of the environment. Considering the importance of the region in terms of Green Infrastructure (GI) and biodiversity, the scientifically-based evidence and the integration of the ES concept to monitoring information is expected to raise the awareness of both the scientific and the decision-making communities and to support the ongoing environmental projects for park management.
Indicators
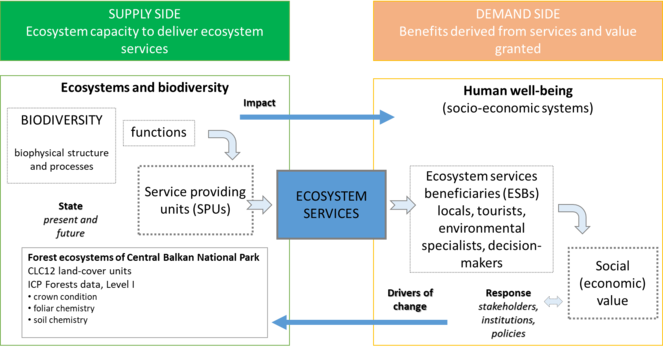
Every ecosystem holds a specific potential to deliver ES defined by its functions. The socially driven demands for these services are the factors that transfer an ecosystem function into a service (Fig.
The empirical analysis, related to the potential services provision, highlights the ecological status of the forests in the Central Balkan region. The biophysical indicators correspond to the definition of services and are derived from biophysical data provided by the ICP Forests monitoring data for the case study area. The indicators define the “final” benefits that could be provided by the ecosystems within a particular land cover unit. According to CICES V 4-3, these indicators also serve as a tool for quantitative assessment and mapping of certain ecosystem services such as Decomposition and fixing processes and Global climate regulation by reduction of greenhouse gas concentrations (Table
Ecosystem services from CICES V 4-3, identified by the selected indicators.
|
Section |
Division |
Group |
Class |
Class typeCICES |
Indicator MetEcosMap |
Unit MetEcosMap |
IndicatorMAES |
|
REGULATION & MAINTENANCE |
Maintenance of physical, chemical, biological conditions |
Soil formation and composition |
Decomposition and fixing processes |
By amount /concentration and source |
Soil organic matter |
% |
Soil organic matter Amount of dead wood Thickness of the organic layer |
|
Atmospheric composition and climate regulation |
Global climate regulation by reduction of greenhouse gas concentrations |
By amount, concentration or climatic parameter |
Organic matter stock |
t CO2 eq/ha (t C/ha) |
C storage in forest; C sequestration by forest (Net Primary Production; Net Ecosystem Production)Forest growth, growing stockNumber of CO2 emissions permits |
||
|
Green infrastructure area |
ha/capita |
The indicators proposed for the identification of the ES from CICES - pH, thickness of the organic layer, soil type, concentrations of carbon and nitrogen, are further developed and supplemented with more details in the MAES framework (
The ICP Forest monitoring network detects and keeps record of laboratory analysis and information on the soil profiles for each site (ICP level I) including data for pH (CaCl2), Total Organic Carbon (g/kg), Total Nitrogen (g/kg), mean dry bulk density of the soil, heavy metals etc. Later, these indicators were used to calculate the Soil Organic Carbon (SOC) stock and the Soil Organic Matter (SOM) as indicators for the provision of regulating ecosystem services.
Soils have a crucial role in the ecosystem functioning. The soil type is an important landscape indicator and can be used to characterise the forest ecosystems. Therefore, it was important to identify the different soil types for better characterisation of the mapping units. Spatial information for the soil types was obtained from the JICA Project database and was adapted to FAO-WRB.
Spatial units
The ecosystem integrity and the landscape peculiarities depend on the cumulative interaction of all natural and social components described in the human-environmental systems. The CLC 2012 data obtained from the Copernicus land monitoring inventory was used to delineate polygons as the smallest-scale spatial units to identify and map the ES. Given the land cover dataset, relevant up-to-date information can be used as a reference base for further investigations.
The data processing and the elaboration of maps was realised under the ESRI ArcGIS platform. The application of the ecosystem services concept is relevant to depict the spatial and temporal dynamics of the soil properties in the forest ecosystem functioning. As the study concerns especially forest lands (incl. forest stands and lands with natural vegetation), ecosystem types such as urban areas, water bodies and bare rocks have been excluded from the selection.
At the next stage, the spatial overlay of the two sets of data (CLC and soil) was made to generate spatial units for analysis, assessment and mapping of the ecosystem services (Equation 1).
Equation 1: CLC12/(Soil Type) = UNIT ID
Once the polygons have been identified (e.g. polygon with unit ID #053 is characterised by mixed broad-leaved forests on Planosols), they were connected to the plots of the existing network – ICP Forest Level I. The specific objective of this step was to be able to observe the changes and the potential of the forest ecosystems to provide ecosystem services with regards to the dynamics of the soil properties. To demonstrate the highest potential to supply the particular ecosystem services, two periods were considered that can detect the dynamics in forest ecosystems. The available records in the ICP Forest monitoring network date back to 1992/93 and the last ones are from 2015. Therefore, the period from 1992/93 until 2015 has been delineated and used as a historic reference to track the changes to the present.
Data collection and mapping
The mapping approach provides information about the spatial distribution and allocation of the defined services. One of the main advantages of this method is the opportunity to represent and visualize data collected from field surveys and empirical estimates in GIS. The approach for mapping and assessment in forest ecosystems, developed in the national methodology, was applied to identify the appropriate indicators and to rank their values with scores in order to describe the capacity of the ecosystem to supply selected regulating ES. Based on information and data collected from the ICP Forests monitoring network, biophysical data have been estimated and have been associated with each delineated spatial unit. The main goal was to gather quantitative data and to map territories representative for the region, where the anthropogenic influence is relatively low. The selection of quantitative indicators and their integration in the mapping process uncovers the actual ecosystem service supply of forests. At a later stage, the values have been transferred into GIS and have been aggregated to a 5-point Likert scale (1-5) considering the assumption that the interval between the values is equal and that each interval contains values.
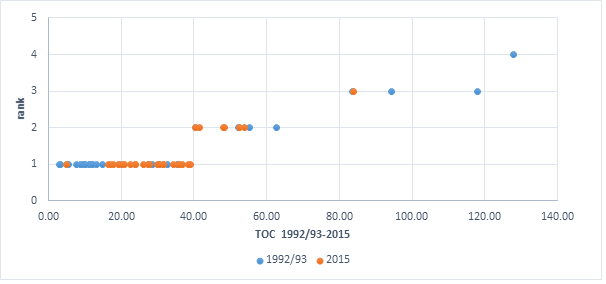
Statistical distribution was applied to the entire ICP data sample. Firstly, the Total Organic Carbon (TOC) and the Soil Organic Carbon (SOC) values were classified for each soil layer and assessed with a corresponding score (1-5). Later, when assessing the ecosystem services, the estimates were considered for the entire soil profile (0-20 cm), which resulted in reclassification of the given ranks for the separate indicators.
The data, derived from the analysis of the organic carbon in soil for the period from 1992/1993 to 2015, illustrate the trend in the parameter values (Fig.
To demonstrate the highest potential to supply the particular ecosystem services, two periods are considered that can detect the dynamics of the soil properties in selected forest areas in the region. Data for different indicators collected from ICP Forests Level I plots were analysed for the period from 1992/93 (first observation) to 2015. The carbon stored in the topsoil layer (soil organic carbon) is identified by two variables. The first is the mean dry bulk density of the fine earth in kg/m3. The second is the TOC contained in the soil organic matter of each soil type in layers from 0-10 cm and 10–20 cm. The values were used to rank this indicator and to associate with the relevant score 1-5. The SOC (t/ha) is given by the following equation:
Equation 2: Soil organic carbon (SOC)=C×H×Q×K
Where:
C – carbon content (%), H – thickness of the soil layer (cm), Q – bulk density (g/km3), K – (100 – Ck)/(100) (%) correction coefficient considering skeletal fraction Ck.
The SOC represents 0.58% of the soil organic matter stock. Therefore a factor of 1.72 (Van Bemelen factor) was used to convert from SOC to SOM [%]. The estimates resulting from the carbon content in the topsoil were further used as indicators for the ecosystem service Decomposition and fixing processes. An increase in SOM stock and in the C concentrations is thus recognised as leading to greater biological diversity in the soil and to having regulating functions over the biological control of plant diseases and pests. The Level I data principally describe the topsoil layer to a depth of 20 cm. In general, the decrease in SOC content is proportional to the increase in depth for mean SOC content and is estimated below 20% (
Statistical distribution to define the score was also applied to the SOC estimates. The mean, median and coefficient of variation, based on the data obtained for the entire time of observation, were calculated. For the period 1992/93-2015, the median is 38.25 and the mean equals to 44.06, giving a coefficient of variation of 0.67, which characterises low variance in the distribution of SOC data for the period of 20+ years.
Later the data were distributed into equal intervals and this method was used to classify the values into a certain number of categories with ranges equal to 40 in 5 classes with attribute values from 0-140. The datasets for the ICP Level I observation plots were distributed in 5 categories (ranks) from 1-5 (Fig.
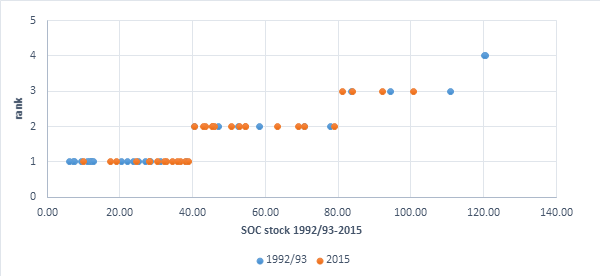
The decrease in the overall SOC concentration for the 2015 dataset indicates higher SOC accumulation over time, which equals the C sequestration rates. The climatic conditions (rainfall and temperature), soil characteristics (clay concentration), soil erosion and degradation and land use practices (arable land, grassland, agricultural farming) are some of the potential variables related to the analysis of the SOC stock. Interestingly, for observation year 2015, most of the values are clustered in the intervals 10-40 and 40-80 and, for observation year 1992/93, they vary between 6.08 and 38.42 t/ha.
The SOM stock, in combination with the GI area, is also one of the representative indicators for the ES Global climate regulation by reduction of greenhouse gas concentrations. Globally, as containing over two-thirds of the soil carbon, forest ecosystems are considered as significant carbon sinks that play an important role in the carbon cycling and in climate regulation. The GI index is derived from calculations on the basis of amount of GI per capita. In the present research, for the Central Balkan region, the GI index is estimated on the average value of the available indices for the adjacent municipalities (Table
|
Amount of Green infrastructure per capita (LUISA Platform REF2014) |
haPC_2014 |
|
Pazardzhik |
0.09 |
|
Plovdiv |
0.23 |
|
Pleven |
0.24 |
|
Sofia |
0.25 |
|
Stara Zagora |
0.35 |
|
Veliko Tarnovo |
0.46 |
|
Vratsa |
0.41 |
|
Average |
0.29 |
The functional relationship between the biotic components in forest ecosystems can also be characterised with the processes frequently affected by changes in biodiversity including climate regulation and carbon sequestration. To perform a comprehensive analysis of the ecological dynamics, however, complex factors corresponding to the status of forest ecosystems, ecological cycles and terrain aspect as well as man-made influences, should be considered.
Results
The ICP Forests monitoring data provide comprehensive information for the relevant indicators for the assessment of several ecosystem services. The spatially explicit assessment of the regulating ES, associated with each land cover unit, allows the elaboration of ecosystem services supply maps (Fig.
The classification applied to the measured indicators showed that the ecosystem services supply is characterised by values that range from 1 - very low supply capacity to 3 - medium supply capacity. Regarding the score estimations pattern for the selected forest stands from the study area, the values of the analysed indicators do not correspond to higher scores and exclude the category 4 and 5. Therefore, there are no ecosystem services that are assessed with higher scores according to the estimates for the assigned indicators.
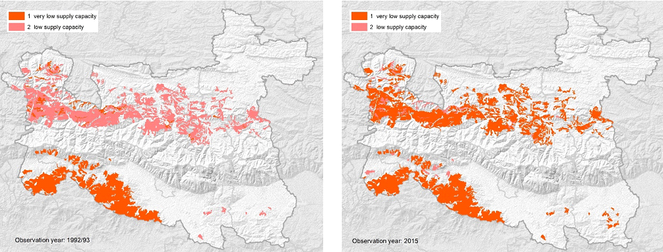
Decomposition and fixing processes
The estimates demonstrate that, for polygons with natural grasslands (code 321, CLC 12) on Planosols, there are no changes detected in the last 20+ years (Fig.
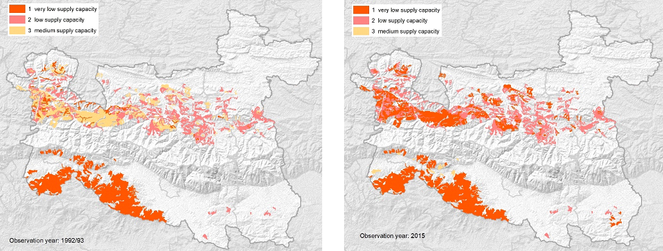
Global climate regulation by reduction of greenhouse gas concentrations
Estimations for TOC and for GI per capita indicate significant variations in broad-leaved and mixed forests on Planosols and Cambisols. For a period of 20+ years, the score corresponding to the capacity for supply of this service within broad-leaved forest has dropped from low to very low (Fig.
According to data for observations from 2015, only natural grasslands on Planosols have better capacity to supply that service. For the rest of the territory, it can be assumed that the dynamics in the soil properties in selected forest ecosystems have had a negative effect.
The Supply matrix on Table
|
Regulation & Maintenance observation year: 2015 |
Decomposition and fixing processes | Global climate reg. by reduction of greenhouse gas concentrations | ||
| soil type | CLC12 | LCLU | ||
| Luvisols | 313 | Mixed forests | 1 | 1 |
| Planosols | 311 | Broad-leaved forests | 1 | 1 |
| 313 | Mixed forests | 1 | 2 | |
| 321 | Natural grasslands | 2 | 2 | |
| 243 | Land principally occupied by agriculture with significant areas of natural vegetation | 1 | 2 | |
| Cambisols | 311 | Broad-leaved forests | 1 | 1 |
| 312 | Coniferous forests | 2 | 3 | |
Discussion
Changes with global impact, such as climate change, land use and land management practices, vegetation state and forest health and water quality and availability, all influence soil functions. The effect of these changes is often closely linked to the SOM amount. The dynamics in the soil properties and, in particular, the SOM play a central role in the functions of the forest ecosystems.
The GI is of very high value for the capacity of the ecosystems to capture and to remove air pollutants. The European monitoring network, ICP Forests, provides harmonised data and information about potential indicators related to the ecosystem’s capacity to provide certain regulating ecosystem services. However, there are limitations imposed by the robustness of the data and application of the ES concept. The data analysis and assessment of the ES demonstrate that, when using a set of indicators and assessing separately each indicator, the resulting final scores change for the given ES. The corresponding scores for the assessed ES vary from 1 to 3 and no values have been assigned to the higher categories (scores 4 and 5). Therefore, it is recommended to take the entire soil profile into consideration for further analysis of the dynamics of soil properties.
The presented comparison in Table
Changes in the area of the land cover classes occupied by forest vegetation for Central Balkan region.
|
Land cover class |
CLC 1990,ha |
% of the total area |
CLC 2012,ha |
% of the total area |
Change |
|
311. Broad-leaved forests |
459701.58 |
56.39% |
444280.87 |
54.50% |
-1.89% |
|
312. Coniferous |
8388.71 |
1.03% |
8210.14 |
1.01% |
-0.02% |
|
313. Mixed |
74093.71 |
9.09% |
80452.62 |
9.87% |
0.78% |
|
321. Natural grasslands |
38863.41 |
4.77% |
38294.21 |
4.70% |
-0.07% |
|
322. Moors |
3725.01 |
0.46% |
3590.29 |
0.44% |
-0.02% |
|
324. Transitional woodland-scrub |
29518.26 |
3.62% |
32761.35 |
4.02% |
0.40% |
In this study, the authors present an experimental methodology that attempts to investigate a tentative correlation between the soil properties of the forest ecosystems and their potential to provide services. Yet, when referring to spatial interrelations between landscape components and depicting the ecosystem functions, the matter of scale of the geospatial data is challenging. Therefore, the landscape-ecological approach can be successfully applied for in-depth analysis of the dynamics in forest ecosystems. The application of more detailed soil datasets will improve the results obtained and will add more value to the overlay spatial analysis.
The integration of the ICP Level I data for observation plots in the Central Balkan area, provides opportunities to expand and supplement the existing database with new materials and estimates. In addition, the present research attempts to set the basis for more profound studies with potential to be used in local and national policy development strategies and programmes on natural resource use and management.
Conclusion
The results obtained indicate that spatially explicit indicators for the capacity of the forest ecosystems to provide services are needed to define the dynamics in the soil properties over time. Considering the data derived from observations within a period of 20+ years, the dynamics in the soil properties in forest ecosystems show significant changes in the supply of the analysed ecosystem services. Regarding the provision of Decomposition and fixing processes, areas occupied by broad-leaved forests on Planosols are characterised by lower SOM quantities and lower supply capacity, whereas the natural grasslands on Planosols do not demonstrate any changes. Similarly, the capacity of broad-leaved forests on Planosols to supply the ES Global climate regulation by reduction of greenhouse gas concentrations has also decreased. In contrast, natural grasslands on Planosols show better results in the provision of that service.
The elaborated maps can serve to identify priority areas and hence to assist in undertaking relevant policy measures by fulfilling the obligations from the Member States to step up countermeasures to reduce the CO2 emissions in the atmosphere. In addition, by further developing the proposed methodology, it is anticipated that useful information can be provided that will facilitate the dialogue between science and decision-making regarding the implementation of the concept to the environmental management initiatives.
Bearing in mind the present environmental management needs, the application of an integrated approach fosters the achievement of better results and also asserts the recognition of the ecosystem services approach in science and practice. The selection of accurate and consistent indicators for the assessment is crucially important. Maps represent quantitative and qualitative information and, as powerful visualisation tools, illustrate the spatial distributions of ecosystem services in the study area using the examples of Decomposition and fixing processes and Global climate regulation by reduction of greenhouse gas concentrations. The SOC stock is essential for soil fertility and forest ecosystems are typically characterised by high SOC content. The SOC differences between the two observed time periods seemed to be mainly influenced by elements of land use management practices.
Acknowledgements
Тhe paper was published with the support of the project “Methodological assistance for ecosystems assessment and biophysical valuation (MetEcosMap)”, funded by the FM of EEA 2009-2014. The study was realised under the TUNESinURB project (FM of EEA 2009-2014) and under the research project InForEco (National Scientific Fund, Ministry of Education and Science DM16/5, 20.12.2017). The data about ICP Forests Level I monitoring plots were provided by the ICP Forests National focal point (Executive Environmental Agency - MoEW) and by the FRI-BAS databases.
References
- Ecosystem services and environmental decision making: Seeking order in complexity.Integrated Environmental Assessment and Management9(2):214‑230. https://doi.org/10.1002/ieam.1389
- Avetisyan D, Borisova B, Nedkov R (2016) Determination of the Landscapes Regulation Capacity and Their Role in the Prevention of Catastrophic Events: A Case Study from the Lom River Upper Valley, Bulgaria. Sustainable Mountain Regions: Challenges and Perspectives in Southeastern Europe. https://doi.org/10.1007/978-3-319-27905-3_13
- A comparative assessment of decision-support tools for ecosystem services quantification and valuation.Ecosystem Services5:27‑39. https://doi.org/10.1016/j.ecoser.2013.07.004
- Boyanova K, Nedkov S, Burkhard B (2014) Quantification and Mapping of Flood Regulating Ecosystem Services in Different Watersheds – Case Studies in Bulgaria and Arizona, USA. Lecture Notes in Geoinformation and Cartography. https://doi.org/10.1007/978-3-319-08180-9_18
- Solutions for sustaining natural capital and ecosystem services.Ecological Indicators21:1‑6. https://doi.org/10.1016/j.ecolind.2012.03.008
- A blueprint for mapping and modelling ecosystem services.Ecosystem Services4:4‑14. https://doi.org/10.1016/j.ecoser.2013.02.001
- Drivers of treeline shift in different European mountains.Climate Research73:135‑150. https://doi.org/10.3354/cr01465
- Roots biomass and carbon in representative Forest ecosystems in Bulgaria.Journal of Chemical, Biological and Physical Sciences5(2):2090‑2108.
- Mapping forest ecosystem services: From providing units to beneficiaries.Ecosystem Services4:126‑138. https://doi.org/10.1016/j.ecoser.2013.03.003
- Ecological status of xerothermic oak ecosystems in SCI “Zapadna Stara planina i Predbalkan.Bulgarian Journal of Agricultural Science20(Supplement 1):105‑109.
- A tiered approach for mapping ecosystem services.Ecosystem Services13:16‑27. https://doi.org/10.1016/j.ecoser.2014.10.008
- Review of decision support tools to operationalize the ecosystem services concept.Ecosystem Services26:306‑315. https://doi.org/10.1016/j.ecoser.2016.10.012
- Challenges in integrating the concept of ecosystem services and values in landscape planning, management and decision making.Ecological Complexity7(3):260‑272. https://doi.org/10.1016/j.ecocom.2009.10.006
- Methodologies for defining and assessing ecosystem services.JNCC, Project Code C08-0170-0062(14).
- Haussmann T, Fischer R (2005) The forest monitoring programme of ICP forests - A contribution to biodiversity monitoring. Monitoring and Indicators of Forest Biodiversity in Europe - From Ideas to Operationality.
- Distribution of Organic Carbon in Soil Profile Data.EUR 23980 ENhttps://doi.org/10.2788/33102
- ‘The Matrix Reloaded’: A review of expert knowledge use for mapping ecosystem services.Ecological Modelling295:21‑30. https://doi.org/10.1016/j.ecolmodel.2014.08.024
- Interactions of ecosystem properties, ecosystem integrity and ecosystem service indicators—A theoretical matrix exercise.Ecological Indicators28:54‑78. https://doi.org/10.1016/j.ecolind.2012.09.006
- Green spaces in the direct living environment and social contacts of the aging population.Landscape and Urban Planning129:44‑54. https://doi.org/10.1016/j.landurbplan.2014.05.003
- Mapping ecosystem services for policy support and decision making in the European Union.Ecosystem Services1(1):31‑39. https://doi.org/10.1016/j.ecoser.2012.06.004
- MAPPING AND ASSESSMENT OF ECOSYSTEMS AND THEIR SERVICES - An analytical framework for ecosystem assessment under Action 5 of the EU Biodiversity Strategy to 2020.European Union3https://doi.org/10.2779/12398
- Nature-Based Solutions for Europe's Sustainable Development.Conservation Letters10(1):121‑124. https://doi.org/10.1111/conl.12216
- An indicator framework for assessing ecosystem services in support of the EU Biodiversity Strategy to 2020.Ecosystem Services17:14‑23. https://doi.org/10.1016/j.ecoser.2015.10.023
- Assessment ME (2005) Ecosystems and Human Well-being: A Framework for Assessment. In: Watson R, Zakri AH The Millenium Ecosystem Assessment.
- The indicator side of ecosystem services.Ecosystem Services1(1):26‑30. https://doi.org/10.1016/j.ecoser.2012.06.001
- Proceedings. 21-22 April 2016.Seminar of Ecology - 2016 with international participation,Sofia. [ISBN979-853-476-132-4].
- Monitoring on health stat us of Pinus nigra arn. plantations in Middle and East Stara Planina.Forest science(2)3‑14.
- Investigations on the health status of tree species from genus Quеrcus (Q. rubra, Q. petraea, Q. frainetto, Q. cerris) in Middle and East Balkan range.Forest science(3)3‑16.
- Monitoring of the health status of Fagus sylvatica l. and Fagus orientalis lypski in Middle and East Stara Planina.Forest science(4)15‑30.
- Harmonizing methods for assessing carbon in forest soils.Management and Sustainable Development16(1):130‑135. [InBulgarian]. URL: http://oldweb.ltu.bg/jmsd/files/articles/16/16-14_M_Sokolovska_M_Zhiyanski.pdf
- Spatial indicators for the assessment of ecosystem services: Providing, benefiting and connecting areas and landscape metrics.Ecological Indicators21:80‑88. https://doi.org/10.1016/j.ecolind.2012.02.013
- Integrating spatial valuation of ecosystem services into regional planning and development.Ecosystem Services26:329‑344. https://doi.org/10.1016/j.ecoser.2016.11.008
- Assessing and mapping global climate regulation service loss induced by Terrestrial Transport Infrastructure construction.Ecosystem Services4:73‑81. https://doi.org/10.1016/j.ecoser.2013.02.007
- Proceedings, Vol. 1 and Vol. 2.6th International Conference on Cartography and GIS,Albena, Bulgaria,13-17 June, 2016.Bulgarian Cartographic Associationhttps://doi.org/10.13140/RG.2.2.33019.92964
- Land-use Change Effects on Soil Organic Carbon and Nitrogen Contents in Ecosystems from Central Balkan Mountains, Bulgaria.Journal of Balkan Ecology11(4):397‑411.
- Soc stock in different forest-related land-uses in central Stara planina mountain, Bulgaria.Glasnik srpskog geografskog dru?tva89(4):99‑107. https://doi.org/10.2298/gsgd0904099z
- Zhiyanski M, Gikov A, Nedkov S, Dimitrov P, Naydenova L (2016) Mapping Carbon Storage Using Land Cover/ Land Use Data in the Area of Beklemeto, Central Balkan. In: Koulov B, Zhelezov G (Eds) Sustainable Mountain Regions: Challenges and Perspectives in Southeastern Europe. https://doi.org/10.1007/978-3-319-27905-3