|
One Ecosystem :
Research Article
|
|
Corresponding author: Alessandra La Notte (alelanotte@gmail.com)
Academic editor: Matthias Schröter
Received: 06 Sep 2017 | Accepted: 10 Dec 2017 | Published: 18 Dec 2017
© 2017 Alessandra La Notte, Alexandra Marques
This is an open access article distributed under the terms of the Creative Commons Attribution License (CC BY 4.0), which permits unrestricted use, distribution, and reproduction in any medium, provided the original author and source are credited.
Citation:
La Notte A, Marques A (2017) The role of enabling actors in ecosystem service accounting. One Ecosystem 2: e20834. https://doi.org/10.3897/oneeco.2.e20834
|
|
Abstract
When accounting for ecosystem services, it is important to distinguish between the flow of services and the flow of benefits (which can be part of economic accounts or not) generated by those services. To disentangle services and benefits, particular attention has to be paid in allocating each category of flows in the use table to those institutional sectors that generate the need for the services and have the power to modify them - the enabling actors - and to final beneficiaries. The general concept of use, without specifying whether services or benefits are referred to, could in fact lead to misinterpretations. This paper discusses the issue of the allocation of ecosystem services and the role of enabling actors through a practical example of water purification accounts in the Netherlands. In particular, the role of the agricultural sector as an enabling actor is disentangled from the cleaned water as benefit and from water supply companies as beneficiaries. The proper allocation of the flow of the service can in fact facilitate the establishment of a causal relationship between the actions of economic actors and ecological consequences and vice versa.
Keywords
System of Environmental-Economic Accounting - Experimental Ecosystem Accounts (SEEA-EEA), ecosystem services, enabling actors, Water purification
Introduction
The importance of ecosystems, their services and sustainable use for long-term human well-being is being increasingly recognised (
The SEEA-EEA defines ecosystem services as the contribution of ecosystems to benefits used in economic or other human activity and records them in Supply and Use tables (SUTs). The SUTs are a powerful tool in environmental accounting because they enable the establishment of linkages and dependencies between environmental and economic flows. In ecosystem services accounting, the Supply table records the amount of ecosystem services supplied by the different ecosystem types*
Testing the SEEA-EEA is fundamental to reveal its limitations and challenges and to foster its improvement towards its adoption as an official statistical standard. One of the areas of high priority for testing and further development is how to account for degradation in ecosystem accounting, even more so since degradation is left out from the SEEA-CF (
Sometimes beneficiaries and enabling actors overlap, but in other cases, there are clear differences that have to be considered in accounting terms. For example, when a factory releases a pollutant into a stream, it is enabling the generation of the water purification service, but the factory does not directly benefit from the cleaned water eventually generated; instead water companies and households will be the direct beneficiaries of cleaned water (
Water Purification Accounts
The application reported here concerns a regulating ecosystem service characterised by being a sink-related service*
Here the focus is on the accounting tables and their interpretation. Specifically, it is important to show how Supply and Use tables would look when applying the accounts as currently reported in SEEA-EEA (
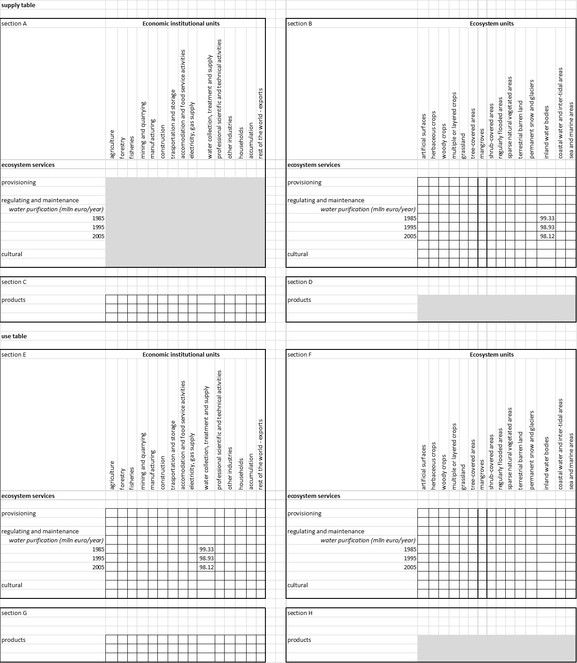
Water purification accounts according to SEEA-EEA - allocation to final beneficiaries
According to the SEEA-EEA, SUTs record actual flows. In the Use table, actual flow is attributed to water supply companies that are the beneficiaries of the clean freshwater generated through water purification (Fig.
Water purification accounts according to the enlarged SEEA-EEA - allocation to enabling actors
Fig.
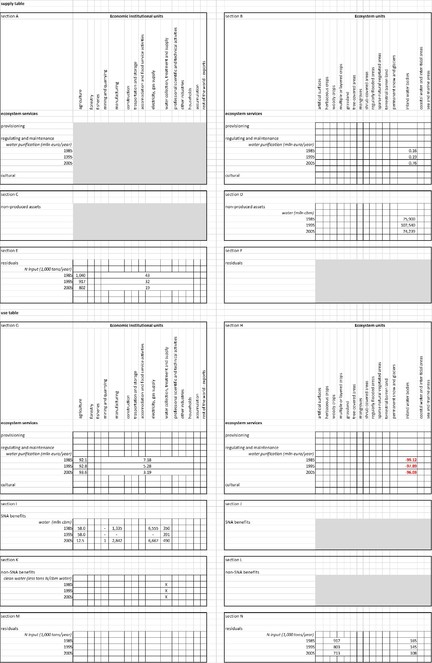
The residual section was also included, this being part of the SEEA-CF [Section E and Section N]. The reader should bear in mind that N emissions reported here are the same input variables used in the biophysical model adopted to assess the water purification service: there is an accounting linkage that inherently connects the N emission account to the water purification account. It is indeed through this linkage that the causal relationship between N emissions and the value of water purification is established: the more N emitted, the more N removal which is assessed by the biophysical model and thus valued as water purification (and vice versa).
The environmental asset more closely related to water purification is inland water bodies. Data related to actual flow of water [section D] and gross total abstraction [section I] are withdrawn from Eurostat datasets. The reason to look at water resources is justified by the non-SNA benefit generated by water purification, i.e. clean water [section K]. It should in fact be calculated as the fraction of N cleaned freshwater abstracted by water supply companies. At the moment, this indicator is not available: what matters in the frame is to show where to allocate the number in terms of “what” (i.e. the indicator of clean water related to the outcome of the biophysical model [N removed] and the water abstracted by water supply companies) and to “whom” (the beneficiary: water supply companies). To have residuals in the frame greatly helps in seeing the linkage with the service flow. The N input reported in the tables is the same input variable that runs into the model and should be consistent with Eurostat datasets. The frame is fully consistent. First, it is possible to link higher/lower N input [section E] to a changing level, as measured in the monetary value of water purification flow [section B], to detect which part of N is retained in soil (that is not part of the water purification service) and which part flows into the inland waters [section N]. Second, by reporting the sustainable flow [section B] and actual flow [section G], it is possble to assess whether the current management is sustainable [section H, which is obtained by the difference between section B and section G]. A negative sign shows that degradation is occurring and also its order of magnitude. The case of the Netherlands is very critical when checking the difference between the very low sustainable flow and the excessive actual flow. In Europe, the only countries where the sustainable flow is higher than the actual flow are Sweden, Norway and Finland (
The meaning of the negative numbers in [Section H] can be seen as depreciation of natural capital, i.e. the consumption of fixed capital in accounting terms. In other words, the overuse of water purification (negative sign) lowers the capacity of inland water ecosystems to provide the same amount of the water purification service in the coming years. The lost capacity can be tracked on the biophysical dataset when the N outflow for each sub-catchment becomes gradually equal to the N inflow: this implies that N cannot be removed and thus that inland waters are being degraded (
Fig.
Outcome analysis
In this section, the interpretation of the information reported on the Supply and Use Tables presented in the case study is provided. Results are analysed by addressing one specific issue: the causal relationship between the action of economic actors and ecological degradation. For the Netherlands, the assessment and valuation of the actual flow and the trend for the selected years suggest that when N emissions [section G and section N] are high, water purification's actual value [section G] is high, when N emissions are low, water purification's actual value is low (Fig.
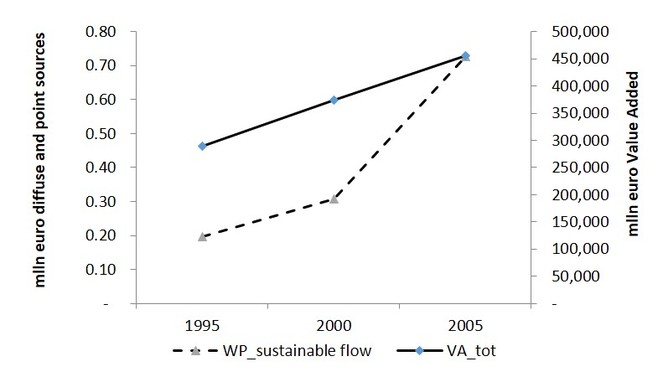
A different trend and very different monetary values, emerge when assessing and valuing the sustainable flow. The more N emissions decrease [section G and section N], the more water purification's sustainable values increase [section B and section H]. Since degradation has been an ongoing process for a long time, the value of sustainable flows is very low compared to the value of actual flow. In terms of sustainability assessment, considering only the actual flow would then provide misleading information: i.e. N emissions are good and enrich waterbodies. On the other hand, considering the sustainable flow provides the view that the sustainability path has only just begun and that the major player in this path is the reduction of N emissions. This clearly shows up in Fig.
However, the most needed relationship to provide information on the sustainable use of ecosystem services relates to economic accounts (or in other words, information from the SNA). In order to understand how economic production affects the ability of inland waterbodies to provide water purification, the accounting tables filled in the previous section with information from the SNA are compared. In Fig.
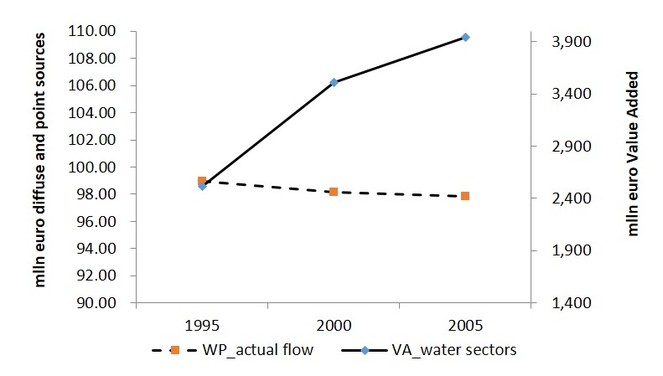
In Fig.
In determining which economic data to relate with relevant ecosystem services, major drivers need to be considered. As can be seen in Fig.
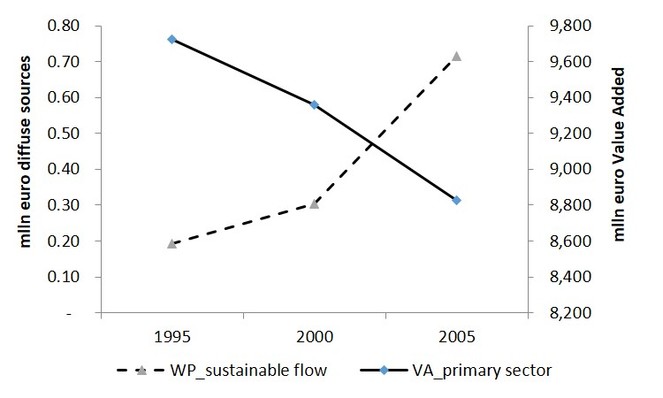
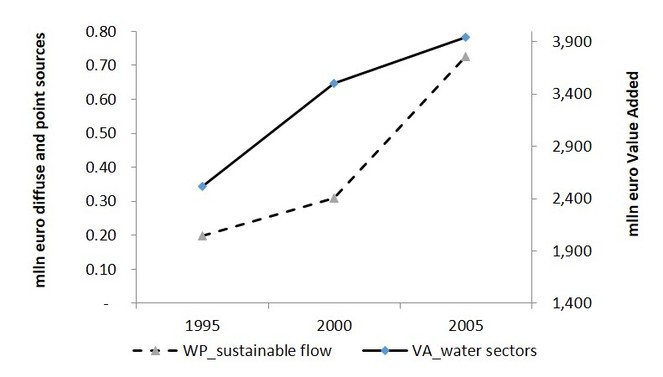
The attempt to establish a link between sustainable flow and water-related companies (Fig.
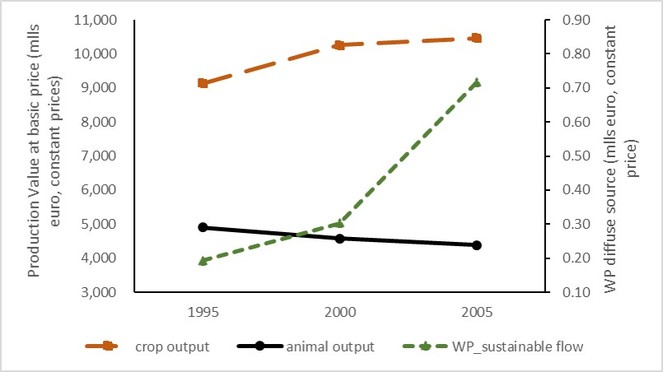
It is important to consider that Value Added measurements also include compensation for employees, taxes on production and imports, subsidies and gross operating surplus. It might be interesting to look at measurements which specifically consider the value of output as the quantity of output multiplied by the price. Specifically, for water purification, it would matter to look at crop output and animal output (Fig.
Conclusions
An accounting system, as support for policy making, should provide information on relationships associated with homogeneous groups of actors in order to evaluate, analyse and forecast economic phenomena (
Already the SEEA-CF acknowledges the presence of a melding of many disciplines, such as economics, statistics, energy, hydrology, forestry, fisheries and environmental science (ref. 2.3
The ecological perspective in terms of 'users' of ecosystem services may require an additional effort to separate services and benefits. For some ecosystem services (especially the sink-related services), final beneficiaries might play no role in affecting the amount and increasing/decreasing trend of ecosystem services flow. When no causal relationship is established, it is not possible to plan and implement policies to address environmental issues. The example of water purification provided demonstrates that the agricultural sector has a common trend with water purification; implementing sustainable practices in agriculture can reduce degradation in water bodies and this can be measured through water purification. Specifically, reducing N outputs from agriculture would improve the capacity of inland waters to provide N reduction services and thereby reduce costs of water purification. It is a powerful means to provide evidence for a number of regulations and policy actions; in Europe for example, the Nitrate Directive and the agri-environment payments of the Rural Development Programmes.
When no causal relationship is established, then it is not possible to develop strategies to reduce ecosystem services degradation. To use residual accounts already in the SEEA-CF is not enough. In the case of water purification, it is possible to read, through the accounting tables, that most of the N emissions are captured by soil and only part of them flow into water bodies. To only consider clean water as benefits is not correct because, in some cases, the beneficiaries of water do not need clean water (e.g. hydroelectric sector). The separation between services and benefits allows in turn the separation of enabling actors from final beneficiaries and thus disentangling and developing that logical step which, in the current SEEA-EEA frame, remains embedded.
Testing of the SEEA-EEA by different specialists in different fields is essential for its improvement and to ensure that ecosystem services accounts hold the necessary data to convey the information on the interdependencies between economies and ecosystems.
References
- From theoretical to actual ecosystem services: mapping beneficiaries and spatial flows in ecosystem service assessments.Ecology and Society19(2). https://doi.org/10.5751/es-06523-190264
- Environmental-Economic Accounting: Progress and Digression in the SEEA Revisions.Review of Income and Wealthn/a‑n/a. https://doi.org/10.1111/roiw.12056
- Modelling mitigation options to reduce diffuse nitrogen water pollution from agriculture.Science of The Total Environment1267‑1277. https://doi.org/10.1016/j.scitotenv.2013.07.066
- Essential SNA: Building the basics.Publications Office of the European Union,Luxembourg,231 pppp. [InEN]. [ISBN978-92-79-36333-7] https://doi.org/10.2785/51610
- Report on phase 1 of the knowledge innovation project on an integrated system of natural capital and ecosystem services accounting in the EU.European CommissionURL: http://ec.europa.eu/environment/nature/capital_accounting/pdf/KIP_INCA_final_report_phase-1.pdf
- System of National Accounts 2008.United NationsURL: http://unstats.un.org/unsd/nationalaccount/docs/SNA2008.pdf
- Defining Ecosystem Assets for Natural Capital Accounting.PLoS11(11):0164460. URL: https://doi.org/10.1371/journal.pone.0164460
- Biophysical Assessment and Monetary Valuation of Ecosystem Services. Scenario analysis for the case of water purification in Europe.Report EUR 25638 EN.Publications Office of the European Union,Luxembourg,72pp. [InEnglish]. [ISBN978-92-79-27799-3] https://doi.org/10.2788/72082
- Implementing an EU system of accounting for ecosystems and their services. Initial proposals for the implementation of ecosystem services accounts, EUR 28681 EN.Publications Office of the European,Union, Luxembourg. https://doi.org/10.2760/214137
- Physical and monetary ecosystem service accounts for Europe: A case study for in-stream nitrogen retention.Ecosystem Services23:18‑29. https://doi.org/10.1016/j.ecoser.2016.11.002
- Ecosystem Assesment - Ecosystems and Human Well-Being.Island PressURL: http://www.millenniumassessment.org/documents/document.356.aspx.pdf.
- A safe operating space for humanity.Nature461(7263):472‑475. https://doi.org/10.1038/461472a
- Accounting for capacity and flow of ecosystem services: A conceptual model and a case study for Telemark, Norway.Ecological Indicators36:539‑551. https://doi.org/10.1016/j.ecolind.2013.09.018
- The Economics of Ecosystems and Biodiversity, Ecological and Economic Foundations.Routledge,Abingdon, UK,410pp.
- System of Environmental-Economic Accounting. Experimental Ecosystem Accounting.United NationsURL: http://unstats.un.org/unsd/envaccounting/seeaRev/eea_final_en.pdf
- Integrated Environmental and Economic Accounting. Studies in Methods - Handbook of National Accounting.UN,New York. [Inenglish]. URL: https://unstats.un.org/unsd/envaccounting/seea2003.pdf
- System of Environmental-Economic Accounting 2012—Experimental Ecosystem Accounting.ST/ESA/STAT/Ser.F/112.UN,New York,194pp. [InEnglish]. URL: http://unstats.un.org/unsd/envaccounting/seeaRev/eea_final_en.pdf [ISBN978-92-79-43926-1]
- System of Environmental-Economic Accounting 2012. Central Framework.United NationsURL: http://unstats.un.org/unsd/envaccounting/seeaRev/SEEA_CF_Final_en.pdf
- SEEA Experimental Ecosystem Accounting: Technical Recommendations. Consultation Draft.United NationsURL: https://unstats.un.org/unsd/envaccounting/ceea/meetings/twelfth_meeting/SEEA%20EEA%20Tech%20Rec%20Consultation%20Draft%20II%20v4.1%20March2017.pdf
- Capacity, pressure, demand, and flow: A conceptual framework for analyzing ecosystem service provision and delivery.Ecological Complexity15:114‑121. https://doi.org/10.1016/j.ecocom.2013.07.004
- The Global Partnership on Wealth Accounting and the Valuation of Ecosystem Services The.World Bank, Washington DCURL: https://www.wavespartnership.org/sites/waves/files/documents/WAVES%20Brochure-web.pdf
- Mapping ecosystem services demand: A review of current research and future perspectives.Ecological Indicators55:159‑171. https://doi.org/10.1016/j.ecolind.2015.03.016
In the SEEA-EEA, ecosystem types refer mostly to different land cover/ecosystem functional units.
According to SEEA-EEA, ecosystem condition reflects the overall quality of an ecosystem in terms of its characteristics (for example, biodiversity, vegetation etc.).
By actual flow, the authors mean the use of an ecosystem service in a given year.
The definition of "enabling actors" is inspired by the SEEA-EEA (ref. Annex 3 in
In the SEEA 2003(
Data from the Eurostat website has been extracted from the "Renewable freshwater resources" [env_wat_res]
Data from the Eurostat website have been extracted from the "Annual freshwater abstraction by source and sector" [env_wat_abs]