|
One Ecosystem :
Case Study
|
|
Corresponding author: Boian Koulov (bkoulov@gmail.com), Ekaterina Ivanova (e_i_ivanova@abv.bg), Bilyana Borisova (bilyana.borissova@gmail.com), Assen Assenov (asseni.assenov@gmail.com), Aleksandra Ravnachka (a_lravnachka@abv.bg)
Academic editor: Miglena Zhiyanski
Received: 08 Jun 2017 | Accepted: 03 Jul 2017 | Published: 04 Jul 2017
© 2017 Boian Koulov, Ekaterina Ivanova, Bilyana Borisova, Assen Assenov, Aleksandra Ravnachka
This is an open access article distributed under the terms of the Creative Commons Attribution License (CC BY 4.0), which permits unrestricted use, distribution, and reproduction in any medium, provided the original author and source are credited.
Citation:
Koulov B, Ivanova E, Borisova B, Assenov A, Ravnachka A (2017) GIS-based Valuation of Ecosystem Services in Mountain Regions: A Case Study of the Karlovo Municipality in Bulgaria. One Ecosystem 2: e14062. https://doi.org/10.3897/oneeco.2.e14062
|
|
Abstract
This study aims to apply approaches, methods, and indicators from the conceptual framework of ecosystem services valuation to a real world, local level case study. It tests a GIS-based mapping and valuation of ecosystem services model in a typical mountain municipality in Bulgaria. Investigation results address opportunities, challenges and limitations in the practical application of the ecosystem services concept. They include an integrated assessment of the ecosystem services in a specific administrative territorial unit and suggest its Total Economic Value. The introduction of the term “ecosystem services dysergy” should contribute to valuation theory and practice. The study upgrades the currently available knowledge base that supports geospatial planning and sustainable development of the Karlovo Municipality and offers recommendations for improvement of the municipal ecosystem services utilization, which include identification, analysis, and visualization of hotspots and dysergy areas.
Keywords
ecosystem services mapping and valuation, ecosystem services dysergy, sustainable governance, mountain regions, Bulgaria
Introduction
The ecosystem services (ES) concept gradually deepens its influence on development of economic theory and practice (
Еconomic assessments of ES in Bulgaria are still limited to individual research initiatives (
This study is prompted by the challenges in the practical application of the ES concept and aims at testing a mechanism which would make its implementation possible in a particular geographic locality. Some of the elements of such a mechanism include information provision and knowledge transfer to the locality that will make the practical value of the novel concept explicit. This concerns especially the benefits that go beyond the currently used comparable conceptualization of "natural resources". To ensure more than “socialization” and understanding, but also psychological “internalization” and motivation to test the new concept within a given locality, public leaders in all spheres and government levels, a “critical mass” of the socially active population, plus an ever open group of stakeholders should be necessarily and sufficiently convinced that this concept utilization will suit the local geographic conditions and provide the locality with a certain comparative advantage. This advantage is expected to be a significant step towards balanced and sustainable governance of the respective locality.
Bulgaria has moved, in accordance with Action 5 of the EU Biodiversity Strategy 2020 (
The main goal of this study is to take this valuable theoretical work one step further and attempt to apply some of the approaches, methods, and indicators around the ecosystem services (ES) concept to a real world, local level case study. Thus, the present investigation tests GIS-based mapping and valuation of ES model to support sustainable governance in a typical mountain municipality in Bulgaria.
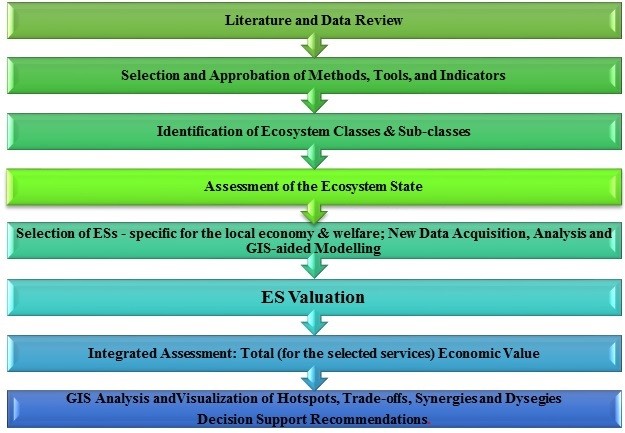
The geographic analyses of Bulgaria's landscape diversity, its economic development, and political-administrative management unambiguously highlight mountain regions as sensitive, vulnerable areas in terms of landscape sustainability and ES governance. The politically most engaging circumstance for the selection of the Municipality of Karlovo as a case study area is rooted in the strong dependence of the local population on the available resources, as well as on the effectiveness of the respective economic initiatives. For the purpose of supporting sustainable decision making in an economically, socially and environmentally vulnerable area, the following basic tasks are identified: a/ Identification & selection of the ecosystems, which form the current and future basis of the local economy and the welfare of the population; b/ Selection and valuation of the ESs; c/ Integrated valuation of the selected municipal ESs; d/ Geospatial analysis of the ES distribution, identification of hotspots, caused by particular geographic patterns and their combinations, synergies and dysergies that results from simultaneous utilization of specific ES; e/ Propose recommendations for improvement of ESs utilization to support sustainable geospatial planning and governance.
Study Area
Karlovo Municipality occupies almost entirely the eponymous off-Balkan valley (Fig.
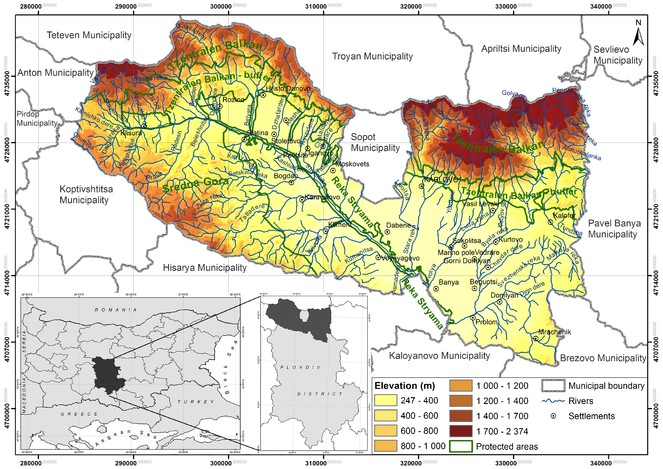
Generally, the physical geographic conditions in the municipality are favorable for economic development, particularly in the tourism and agriculture sectors. The balance of the municipal territory, dominated by forests (51%) and agricultural lands (45%), with 3% urbanized areas, 0.9 % water bodies and 0.4 % transport and energy infrastructure, is quite indicative in terms of the specific development areas of its natural capital.
Administratively, the Karlovo Municipality (LAU 1) is a part of the South Central Region (NUTS 2) of Bulgaria and covers 1% (1044 km2) of Bulgaria’s territory. It comprises of 27 settlements, including 4 towns and 23 villages, with a total population of 50 016 people (NSI, 2016). The rate of urbanization (58% urban) and the population density (47.9 persons per km2) are much lower than the respective average rates for the country (73% and 67.6 persons/km2. During the last 15 years, a steady negative trend characterizes the demographic processes in the Municipality: the population decreased by more than 28%, due mainly to the significant decline in fertility and increase in emigration. As a result of the depopulation, which affects mainly younger people, the average age of the population continuously increases.
The educational characteristics of the municipal population are also worse than the average for its District (NUTS 3) and the country. Only 11% of population of age “seven and older” has higher education and it is predominantly (85%) concentrated in the towns (Karlovo, Klisura, Kalofer, and Banya). The continuing worsening of the demographic potential, the increasing aging of population and the unsatisfactory educational characteristics negatively influence the quantity and quality of the human capital and present one of the most significant limitation factors for the present and future socio-economic development and wellbeing of the Karlovo Municipality.
The continual increase in the number of firms in the nonfinancial sector of the municipal economy during the last 10 years is a positive characteristic, which testifies to the traditional entrepreneurial spirit of the local population. At this stage of development, the increase is due exclusively to the group of the micro enterprises (up to 10 employees), which heavily dominates the municipal economic structure (93% of the total number of enterprises in 2014). Their share is practically the same for the respective NUTS 2 region and the county as a whole. On the negative side, the group of the small enterprises (up to 250 employees) – almost 6% of the total - is continuously decreasing in the municipality, and there are no enterprises of medium size. The three large enterprises, that survived the transition from central planning after 1989, are still in operation. The labor shortage in the municipality is increasing, particularly the lack of highly qualified workers. Altogether, between 2008 and 2014, the overall number of employees has decreased by 6% and this negative tendency is only expected to continue.
Over 16 million euro of foreign direct investments (FDI) entered the nonfinancial sector of Karlovo Municipality in 2014 and over 10 million euro has been invested in tangible fixed assets. Industry heavily dominates the municipal economic structure, in which manufacturing holds the largest share - 57% of the Produced Output, while services produce 35% and agriculture, forestry, and fisheries – about 7%. In terms of Value Added by Factor Costs however, the service sector produces about 50%, manufacturing only 45%, and agriculture, forestry, and fisheries sector – about 4.5%. At present, close to half of the total number of employees (7 563) are engaged in machine building. Metalworking, production of raw materials for the cosmetics industry (Bulgarian Rose Ltd.), wine industry, textile and knitwear industry are among the other economic activities. The large share of industry is not typical in mountain municipalities. Apparently, services hold the most efficient sector in Karlovo and indicate the direction of the future changes in its economic structure.
There are 3825 agricultural farms (including agricultural farms without utilized agricultural area) in the municipality with a total utilized agricultural area of 13010 ha (
The significant forest area (45 083 ha, CLC 2010) determines development of timber industry, hunting, educational, and eco-tourism. “The annual output of the timber industry is between 2 and 2.5 million euro” (
Local authorities aim at increasing the employment opportunities and especially the competitive power of the local economy by encouraging and development of research and development activities, upgrading the business infrastructure, modernizing agriculture, and stimulation of the manufacturing activities which correspond to local traditions and resources. At the same time, raising the quality of education and its close adaptation to local business requirements are seen as pivotal for reaching economic goals and increasing the wellbeing of the local population.
Data and Methods
The study falls under the Conceptual Framework for EU-wide Ecosystem Assessments (
For mapping purposes, ES class types are assigned to the corresponding ecosystem sub-classes (e.g., Non-irrigated Arable Land), which has the potential to provide the respective services. The investigation adheres to the following research propositions: a/ Each ecosystem sub-class can provide more than one ES; and b/ Different ecosystem subclasses can provide one and the same ES class type. The study assigns the monetary value of National Park’s forest ES to all forest ecosystems in the Municipality on the grounds that more than 35% of the Park forest area is actual municipal territory.
A GIS-based approach has been applied to support modeling biophysical and economic indicators. The possibilities of GIS mapping of ES on the basis of an integrated biophysical and economic evaluation (
The assessment of the ecological status and, respectively, the potential of ecosystems to provide services, is based on analysis of information from: a/ the assessment of the state of the habitat types represented in NATURA 2000 protected sites within the CLC Classes at Karlovo Municipality (BG0000429, BG0002054, BG0001389, BG0000494, BG0001493, BG0002128) (
This assessment also rests on the expert opinion that the listed habitat types adequately and in detail reflect the most significant contemporary features of the environment at the local level of analysis. Despite the fact, that these habitats cover only 59.5% of the municipal territory, their geospatial characteristics (e.g., the degree of territorial connectivity among different habitat types and the degree of overlap of the NATURA 2000 areas and protected areas) give ample grounds to accept their status assessment as representative of this territorial unit as a whole.
The system analysis of the habitats, based on criteria, which reflect the habitat structure and functions, as well as influences and threats, has produced assessment results which vary from "favorable" to "poor". The following criteria are most important for this study: occupied area of the natural habitat within the protected area, dominant species, fragmentation within the habitat, housing habitation, ruderalization, grazing intensity, and fire impact. The integration of information on the ecological status of landscapes at the Central Balkan National Park is linked to the facts that it covers 35% of the municipal area and 70% of its ecosystems are natural. Thus, the Management Plan for the Central Balkan National Park (2016-2025) has also provided information about environmental assessment of landscapes and their adjacent ecosystems with respect to the following criteria: biodiversity, typology, natural character, rarity, size, vulnerability, and stability/instability.
The selection of valuation methods results from a preliminary analysis, which has taken into account a number of factors (
At the first stage, the economic value for each ES service class type was calculated, using the formula:
\(ESV = s \times e\)
where: ESV is the economic value of ES class type (€/ha/year); s is the biophysical indicator “value (€) per hectare per year”; and e is the economic indicator “value (€) per unit”. The resulting values are summed according to their ES classes and included in the GIS as separate layers. For example, the values of the separate ES class types - Vegetables, Wheat, Barley, Oats, Corn, Sunflower, Rye, Plums, Pears, Apples, Dessert Grapes, Wine Grapes - are summed into the common value of the ES class “Cultivated Crops”. The GIS model has generated eleven raster layers (Li) with pixel size 27x27 m which contain information on valuated ecosystem services classes in €/ha/yr.
The total economic value (TEV) of an ecosystem pixel in €/ha/yr for the territory of the Karlovo Municipality is calculated as:
\(TEV = \displaystyle\sum_{i=1}^n\displaystyle\sum_{j=1}^mESV_j\)
where: TEV is total (for selected services) economic value of ecosystem services; n=11 is the number of the raster layers; ESVj is the economic value of ES class type j; and m is the number of ecosystem services class types in layer i.
The fact that the actual provision of one ES is dynamically linked to the provision of other services has been accounted for in the analytical process, which accompanies the valuation. The actual flows of a particular service can be interpreted either as a result of other ecosystem functions and services or as a prerequisite for the occurrence of concomitant or derived functions and services. Thus, an intermediate step has been included where necessary in the course of the valuation: an intermediate assessment which accounts for the complex and dynamic character of ecosystem interactions and their mutual interdependencies.
Results
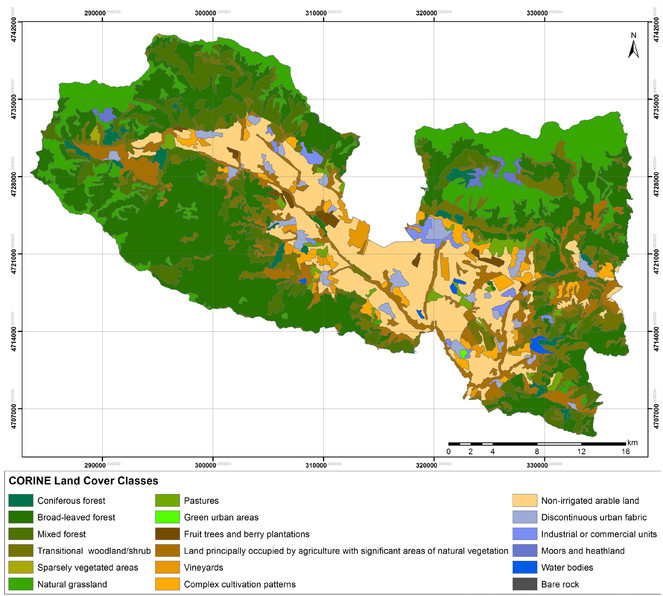
Identification of Ecosystem Classes and Sub-classes
Due to the geographic character of the municipality, only terrestrial ecosystems are considered in this study. The structure of the assessment involves five ecosystem classes (level 2 in
Assessment of the Ecosystems State
The summary evaluation results prompt a generally satisfactory assessment of the ecological status of the habitats that build the main ecosystem subtypes of the municipal territory, with a necessary note to its vulnerability to natural (drought) and anthropogenic factors (pastoral farming, fire). Against this backdrop, the state of the habitats involved in the structure of the riparian landscapes and, more generally, the landscapes of the valley bottom, stands out as unfavorable. The complex anthropogenic overload and especially, the intensive agricultural utilization, is the main cause for this assessment. In conclusion, the overall situation necessitates far greater attention to the regulation of the territorial balances in the process of consumption of material and regulatory services, since over a certain period of time the functional potential of these ecosystems can significantly deteriorate.
The analysis of the assessment results, presented in Table
|
Assessment of the of Ecosystem State |
|||||
|
In scale: favorable – satisfactory – unfavorable - poor |
|||||
|
Habitat Types |
Ecosystem sub- classes at Karlovo Municipality |
Ecosystem’s State Assessment /by Sources/ |
Integrated Assessment of Ecosystem’s state of Karlovo Municipality |
||
|
National ecological network NATURA 2000 Bulgaria /Data Base/ |
Management Plan for The Central Balkan National Park. 2016-2025 /SEA/ |
Field Observations /July-September 2017/ |
|||
|
4060 Alpine and Boreal heaths |
Transitional Woodland/Shrub |
Favorable |
Favorable but highly vulnerable due to grazing and trekking |
Favorable |
Favorable |
|
6210 Semi-natural dry grasslands and scrubland facies on calcareous substrates (Festuco-Brometalia. * important orchid sites) |
Pastures |
Unfavorable |
Favorable but highly vulnerable due to grazing and trekking |
Favorable but vulnerable (ruderalization) |
Satisfactory |
|
6430 Hydrophilous tall herb fringe communities of plains and of the montane to alpine levels |
Natural Grassland |
Favorable |
Favorable but highly vulnerable due to grazing and river stream corrections |
Favorable but vulnerable (grazing) |
Favorable |
|
9110 Beech forest (Luzulo-Fagetum) |
Broad-leaved Forest |
Favorable but vulnerable |
Favorable but vulnerable due to grazing. heavy winds and snow. fires |
Favorable but vulnerable (grazing) |
Favorable |
|
9150 Medio-European limestone beech forests (Cephalanthero-Fagion) |
Broad-leaved Forest |
Unfavorable |
Favorable but vulnerable due to grazing. heavy winds and snow. fires |
Satisfactory but vulnerable (grazing. erosion) |
Satisfactory |
|
9170 Galio-Carpinetum oak-hornbeam forests |
Mixed Forest |
Unfavorable |
Favorable but highly vulnerable due to trekking and afforestation with coniferous species |
Satisfactory but vulnerable (grazing. erosion. fires) |
Satisfactory |
|
91W0. Moesian beech forests |
Broad-leaved Forest |
Favorable |
Favorable |
Favorable |
Favorable |
|
91Ca. Rhodopide and Balkan Range Scots pine forests |
Coniferous Forest |
Unfavorable |
Favorable but highly vulnerable |
Satisfactory but vulnerable |
Satisfactory |
|
9410. Acidophilous Picea forests of the montane to alpine levels (Vaccinio-Piceetea) |
Coniferous Forest |
Unfavorable |
Favorable but vulnerable due to grazing. heavy winds and snow. fires |
Satisfactory but vulnerable |
Satisfactory |
|
9530. (Sub-) Mediterranean pine forests with endemic black pines |
Coniferous Forest |
Poor |
Satisfactory but highly vulnerable due to reduced share of old forests |
Poor (changes in the composition of typical species) |
Poor |
|
91E0. *Alluvial Forest Alnus Glutinosa and Fraxinus Excelsior |
Broad-leaved Forest |
Poor |
Satisfactory but highly vulnerable due to grazing and logging |
Poor (complex anthropogenic pressure) |
Poor |
|
6430 Hydrophilous tall herb fringe communities of plains and of the montane to alpine levels |
Natural Grassland |
Unfavorable |
Favorable but highly vulnerable due to complex anthropogenic pressure |
Satisfactory (complex anthropogenic pressure) |
Satisfactory |
|
6510 Lowland hay meadows (Alopecurus pratensis. Sanguisorba officinalis) |
Natural Grassland |
Unfavorable |
Satisfactory but highly vulnerable due to grazing and ruderalization |
Satisfactory (complex anthropogenic pressure) |
Satisfactory |
Selection of Ecosystem Services
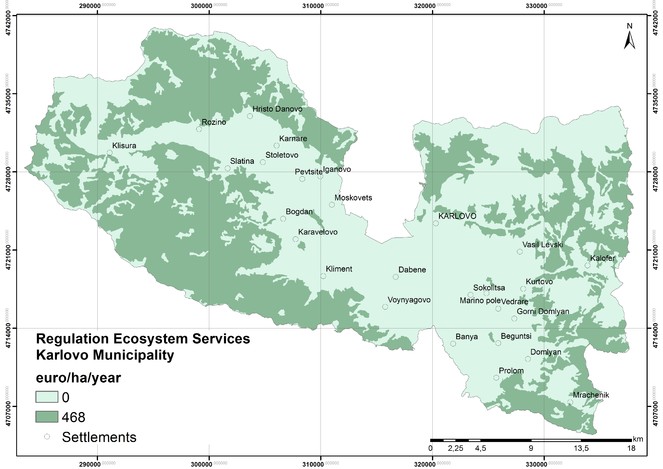
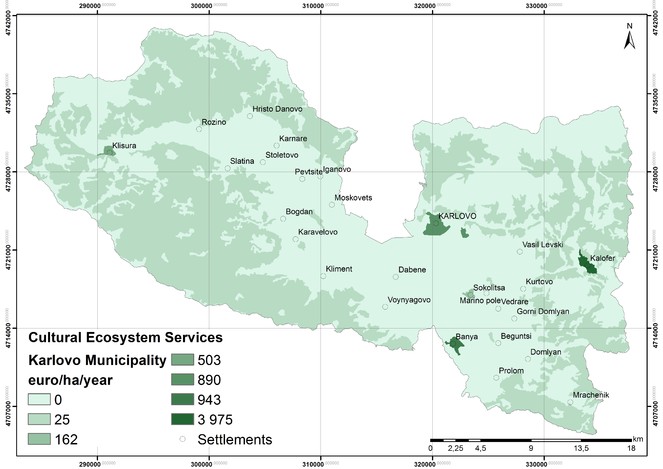
The selection of the ES, that are representative for Karlovo Municipality, is based on synthesis of the results of the statuses of the local demography, economy and ecosystems. In sum, the selection includes the following key ESs: Provisioning (Cultivated Crops, Reared Animals and their Outputs, Wild Plants, Algae and their Outputs, Surface Water for Drinking), Regulation (Mass Stabilisation and Control of Erosion Rates, Hydrological Cycle and Water Flow Maintenance, Global Climate Regulation by Reduction of Greenhouse Gas Concentrations), and Cultural (Physical Use of Land-/Seascapes in Different Environmental Settings). The selected ES belong to 11 ES classes (CICES 4.3) and 29 ES class types (Table
Selection of Ecosystem Services, Representative for Karlovo Municipality.
|
Section |
Division |
Group |
Class |
Class type |
|
Provisioning |
Nutrition |
Biomass |
Cultivated crops |
Vegetables. wheat. barley. oats. corn. sunflower. rye. plums. pears. apples. dessert grapes. wine grapes |
|
Reared animals and their outputs |
Meat and milk (Cow. Goat. Sheep Buffalo). Eggs. Honey |
|||
|
Wild plants. algae and their outputs |
Wild berries and herbs |
|||
|
Water |
Surface water for drinking |
By amount |
||
|
Materials |
Biomass |
Fibres and other materials from plants. algae and animals for direct use or processing |
TimberWool |
|
|
Materials from plants. algae and animals for agricultural use |
Fodder |
|||
|
Genetic materials from all biota |
Game and Wild plants by forest ecosystems. Damask roseDamask rose |
|||
|
Regulation & Maintenance |
Mediation of flows |
Mass flows |
Mass stabilisation and control of erosion rates |
Erosion regulation |
|
Liquid flows |
Hydrological cycle and water flow maintenance |
Water flow maintenance |
||
|
Maintenance of physical. chemical. biological conditions |
Atmospheric composition and climate regulation |
Global climate regulation by reduction of greenhouse gas concentrations |
Greenhouse gas/carbon sequestration |
|
|
Cultural |
Physical and intellectual interactions with biota. ecosystems. and land/seascapes [environmental settings] |
Physical and experiential interactions |
Physical use of land-/seascapes in different environmental settings |
Recreation and tourism |
Data availability is generally one of the main factors which restrict ES selection. In this sense, the present study is not an exception. The Provisioning ES dominate investigators’ selection, not just because of their fundamental significance for the economy, but also due to the relative availability of statistical data. The value of the key Regulation ES in the Municipality is estimated through indirect valuation methods. The results from
The investigation considers Pollination, Water Purification and Natural Hazard Protection as very important for the development of the territory, but the lack of a reliable information base does not allow their inclusion in the present study. The Karlovo Municipality offers a wide range of Cultural Services the majority of which also remain outside the current selection. This is due to the lack of established practice in Bulgaria for data collection regarding this class of services, either at local or national level, which severely limits the choice of a representative valuation indicator.
Ecosystem Services Valuation
The present economic assessment of the selected ES is based on indicators and parameters (Table
Methods and Indicators for Representative Ecosystem Services in the Karlovo Municipality.
|
ECOSYSTEM SERVICES (CICES 4.3) |
Indicator |
Economic method |
Data |
|||||
|
Ecosystem types (level 2) |
Class |
Class type |
||||||
|
Cropland |
Cultivated crops |
vegetables. wheat. barley. oats. corn. sunflower. rye. plums. pears. apples. dessert grapes. wine grapes |
Average yield per year (t/ha/yr. 2015-2016) |
Market price |
National and regional statistics. 2015; Municipality Karlovo statistics. 2016 |
|||
|
Woodland and forest |
Surface water for drinking |
By amount |
Investments in forest plantations |
Net financial contribution (NFCu) |
Central Balkan National Park.
|
|||
|
Grass land |
Sparsely vegetated |
Cropland |
Urban |
Reared animals and their outputs |
Meat and milk (Cow. Goat. Sheep Buffalo). Eggs. Honey |
Average yield per year (t/ha/yr. 2015) |
Market price |
National and regional statistics. 2015 |
|
Woodland and forest |
Grassland |
Sparsely vegetated land |
Wild plants. algae and their outputs |
Wild berries and herbs |
Quantities of non-timber products gathered from the Central Balkan NP. (kg/yr. 2010-2014) |
Market price |
Central Balkan National Park.
|
|
|
Woodland and forest |
Grassland |
Fibres and other materials from plants. algae and animals for direct use or processing |
Timber |
Quantities of timber harvested from the Central Balkan NP. (m3/ha/yr. 2010-2014) |
Market price |
Central Balkan National Park.
|
||
|
Wool |
Average yield per year (kg/yr. 2015) |
Market price |
National and regional statistics. 2015; Municipality Karlovo statistics. 2016 |
|||||
|
Grassland |
Materials from plants. algae and animals for agricultural use |
Fodder |
Average yield per year (kg/ha/yr. 2015) |
Market price |
National and regional statistics. 2015 |
|||
|
Woodland and forest |
Cropland |
Genetic materials from all biota |
Game and Wild plants by forest ecosystems |
Number of permits. Central Balkan NP (2014) |
Value transfer |
Central Balkan National Park.
|
||
|
Damask rose |
Average yield per year (t/ha/yr) |
Market price |
National and regional statistics. 2015 |
|||||
|
Woodland and forest |
Mass stabilization and control of erosion rates |
Erosion regulation |
Cost of restoring soil quality |
Replacement cost |
Central Balkan National Park.
|
|||
|
Woodland and forest |
Hydrological cycle and water flow maintenance |
Water flow maintenance |
Investments in forest plantations |
Net financial contribution (NFCu) |
Central Balkan National Park.
|
|||
|
Woodland and forest |
Global climate regulation by reduction of greenhouse gas concentrations |
Greenhouse gas/carbon sequestration |
Carbon sequestration – forest ecosystems (CO2/yr/ha) |
Value transfer |
Central Balkan National Park.
|
|||
|
Woodland and forest |
Urban |
Physical use of land-/seascapes in different environmental settings |
Recreation and tourism |
Number and capacity of accommodation sites. Site visitation (number/yr) |
Market price |
Municipality Karlovo statistics. 2016 |
||
|
National Statistical Institute. Republic of Bulgaria. Karlovo Municipality http://www.karlovo.bg
(
|
||||||||
The complex and dynamic geospatial interdependencies and interactions that exist among ecosystems often produce ES synergies – positive effects - which additionally increase the added value of the services they produce. The basic concepts used here, such as ES trade-offs and synergies, are theoretically consistent with their terminological interpretation in
Intermediate Valuation of Ecosystem Services with Consideration of the Interactions Among Ecosystems (€/ha/y).
| № | Ecosystem subclasses (represented by CLC2012) with potential to provide particular ES | Currently provided ecosystem services | Ecosystem services consumed from other ecosystems | Economic value accounting the interaction between ecosystems (€/ha/y) | ||
| by class type | Economic value (€/ha/y) | by class type | Economic value (€/ha/y) | |||
| C1 | C2 | C3 | C4 | C5 | C6 | C7=C4-C6 |
| 1 | Forests: coniferous forest, broad-leaved & mixed forest | Water for drinking purpose; Timber; Game and wild plants by forest ecosystems; Erosion regulation; Water flow maintenance; Carbon sequestration; Recreation and tourism | 719.3 | 719.3 | ||
| 2 | Heathland and shrub & Sparsely vegetated areas | Goat milk | 145.92 | 145.92 | ||
| 3 | Fruit trees and berry plantations; Transitional woodland/shrub; Pastures; Natural grasslands; Land principally occupied by agriculture with significant areas of natural vegetation; Non-irrigated arable land; Complex cultivation patterns | Honey | 1.9 | 1.9 | ||
| 4 | Pastures and Natural grasslands | Milk (Cow, Sheep and Buffalo); Wool; Fodder | 1969.61 | Carbon sequestration; Erosion regulation | 433.63 | 1535.98 |
| 5 | Land principally occupied by agriculture with significant areas of natural vegetation | Pattern of cultivated crops (vegetables) | 2733 | Carbon sequestration; Water flow maintenance; Water for drinking purpose | 621.04 | 2111.96 |
| 6 | Non-irrigated arable land & Complex cultivation patterns: | Pattern of cultivated crops (wheat, barley, oats, corn, sunflower, rye); Damask rose | 1812.76 | Carbon sequestration; Water flow maintenance; Erosion regulation | 467.89 | 1344.87 |
| 7 | Fruit trees and berry plantations | Pattern of cultivated crops (plums, pears, apples) | 2678.01 | 2678.01 | ||
| 8 | Vineyards | Pattern of cultivated crops (dessert grapes; wine grapes) | 2535.03 | Carbon sequestration; Erosion regulation | 433.63 | 2101.4 |
| 9 | Forests (coniferous forest, broad-leaved & mixed forest); Sparsely vegetated areas; Transitional woodland/shrub; Pastures; Natural grasslands | Wild berries and herbs | 1.56 | 1.56 | ||
| 10 | Discontinuous urban fabric & Pastures | Eggs | 682.56 | Carbon sequestration; Water for drinking purpose; Erosion regulation | 652.89 | 29.67 |
| 11 | Discontinuous urban fabric | Recreation and tourism - Karlovo | 1501.41 | Carbon sequestration; Water for drinking purpose; Physical use of land in environmental settings | 611.67 | 889.74 |
| Recreation and tourism - Kalofer | 4587.21 | 611.67 | 3975.54 | |||
| Recreation and tourism - Bania | 1554.56 | 611.67 | 942.89 | |||
| Recreation and tourism - Klisura | 1115.1 | 611.67 | 503.43 | |||
| Recreation and tourism - Sokolitsa | 773.71 | 611.67 | 162.04 | |||
Integrated Assessment – Total Economic Value
The estimated TEV of the selected, currently utilized ES in the Karlovo Municipality is close to €115 million. The ecosystems of the valley bottom, which are most intensively used for agricultural purposes, are responsible for the majority of the ES production (Fig.
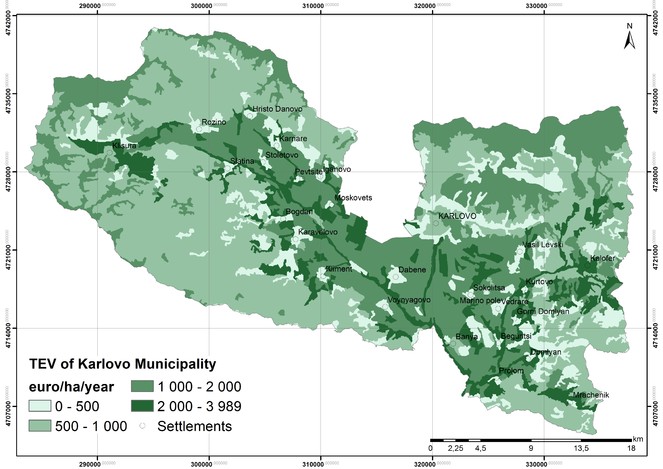
The following three ES – Cultivated Crops, Rearing Animals (a.k.a., animal husbandry), and Global Climate Regulation by Reduction of Greenhouse Gas Concentrations – exhibit highest shares in the TEV structure (Table
Annual Financial Benefits (Euro) Per Ecosystem Services Class and Total Economic Value (TEV).
|
ES section |
ES class |
Ecosystem services class type |
Annual financial benefits (euro) |
|
Provisioning |
Cultivated crops |
Vegetables. wheat. barley. oats. corn. sunflower. rye. plums. pears. apples. dessert grapes; wine grapes |
37 423 402.69 |
|
Reared animals and their outputs |
Milk (Cow. Sheep. Buffalo and Goat); Eggs; Honey |
31 100 149.92 |
|
|
Wild plants. algae and their outputs |
Wild berries and herbs |
109 400.58 |
|
|
Surface water for drinking |
Water for drinking purpose (by amount) |
9 885 080.57 |
|
|
Fibers and others materials from plants. algae and animals for direct use or processing |
Timber; Wool |
222 811.56 |
|
|
Materials from plants. algae and animals for agricultural use |
Fodder |
4 680 547.78 |
|
|
Genetic materials from all biota |
Game and wild plants by forest ecosystems; Cultivated Damask rose |
8 420 102.87 |
|
|
Regulation & Maintenance |
Mass stabilization and control of erosion rates |
Erosion regulation |
2 980 492.00 |
|
Hydrological cycle and water flow maintenance |
Water flow maintenance |
1 544 572.02 |
|
|
Global climate regulation by reduction of greenhouse gas concentrations |
Carbon sequestration |
16 569 209.20 |
|
|
Cultural |
Physical use of land-/seascapes in different environmental settings |
Recreation and tourism |
2 617 013.43 |
|
Total Economic Value (TEV) |
115 552 782.62 |
||
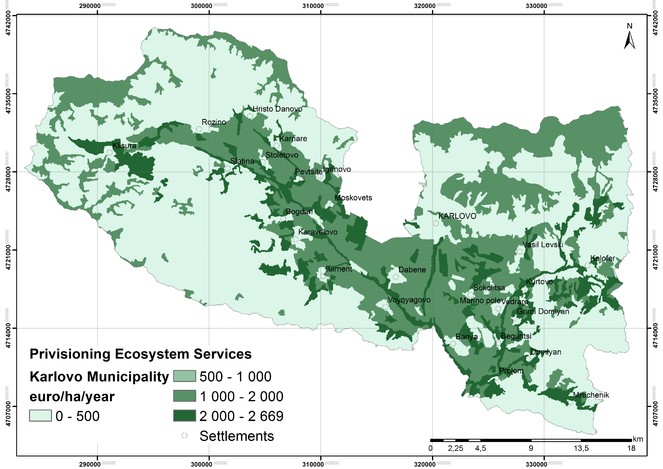
Further geospatial analysis of the valuation results (Fig.
Serious economic prerequisites and even traditions exist in general, as well as in the municipality, to economically “absorb” the highest value ecological assets, particularly for development of alternative types of tourism and local production of clean, renewable, and eco- products. However, this analysis shows that the stimulation of synergistic links between the ecosystems of the valley and those of the surrounding mountains will be advantageous to the municipal economy, society and its environment. Such a venture requires regulators to pay special attention to the environmental status and economic use of the riparian areas (currently occupied mainly by arable land) and the slopes, and in particular, the Land Occupied by Agriculture with Significant Areas of Natural Vegetation and the Transitional Woodland/Shrub lands, which account for almost 18% of the municipality's territory. In conclusion, regulatory measures in that respect will have a positive impact on the balanced and sustainable provision of services in the territory and, at the same time, support the economic specialization of the municipality and people’s welbeing.
Discussion
The proposed GIS-aided model of spatial valuation of ES is intended to mainly serve as a benchmark for future valuation research, especially in bringing to light a substantial share of currently underreported and undervalued ES, for comparative purposes, as well as for an instrument for stimulation of public interest in the concepts of ES and sustainable territorial development. A lot of assumptions and serious limitations related to economic ES valuation exist in this investigation. They include lack of data, reduction of services to "products” and vice versa, exclusion of a multitude of ES that need, first, much deeper investigation (e.g., pollination) and, second, are currently “unrecognized” by the market and even society as a whole.
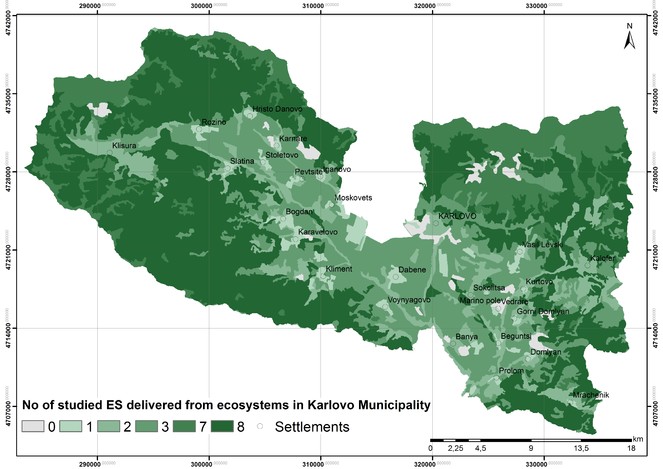
For example, a large proportion (39.6 %) of annual financial benefits from the studied ES in the Karlovo Municipality belongs to cultivated crops – around 45.7 million euro. These benefits are highly dependent on insect pollination. Based on Eurostat statistical data,
Ecosystem multi-functionality is one extremely intricate scientific issue that requires much deeper investigations, including field studies. From a practical point of view, stakeholders and specialists in territorial planning and management have to take into account the complexity of the existing functional dependencies and real and potential ES trade-offs, not only in the distinct ecosystems of interest, but also in the neighboring ecosystems. Moreover, the process cannot be limited by administrative or political boundaries. In valley conditions, this is clearly visible in the vulnerability of the regulating functions, as well as in some material services, such as Surface Water for Drinking or in forest ecosystems in conditions of inappropriate use of the Fibers and other Materials from Plants, Algae and Animals for Direct Use or Processing.
Conclusion
This investigation succeeded to: a/ Update the basic terminology supporting ES classification and evaluation; b/ Overcome some of the challenges of the application of ES valuation methods at the municipal level and the geospatial analysis of their results; c/ Enlarge the currently available information and knowledge basis that support geospatial planning & sustainable development of the Karlovo Municipality.
The following main problems in ES valuation stand out:
- Data availability for the valuation purposes is a serious problem: Eurostat does not include the local levels (LAU) at this time. Data transfer from regional, national, and even global statistics is currently used, which greatly lowers the degree of valuation objectivity and hampers its validation.
- The Provisioning ESs account for the largest share in the structure of the TEV, which artificially increases their overall importance. This is, however, due to the fact that the majority of data that concerns the regulation and cultural ES is more circumstantial and much less objective. Monitoring needs to be further improved in order to include these two ES groups and make the ES concept readily applicable.
- The data collection and mapping approaches used in this case study involve significant generalizations that are suitable for strategic analyses, but show weaknesses in the case of concrete ecosystems or business localizations. Result distortions take place in cases where ES data from a concrete polygon of one ecosystem type is transferred to all polygons of this ES type, even within the same municipality. This is most clearly seen in the "transfer" of the value of the regulating functions from the forest ecosystems of the Central Balkan to those ecosystems in the Sredna Gora Mountain. Another “mapping” discrepancy which is often overlooked is related to the fact that a great share of the tourism and recreation services are consumed in the natural ecosystems, but the largest part of the actual accounting happens and is, therefore, mapped in the urban areas’ services. These challenges can only be avoided through detailed field work, targeted territorial evidence gathering, and in situ monitoring on a case-by-case basis.
Funding program
"National, European, and Civilizational Dimensions of the Culture – Language – Media Dialogue" Program of the "Alma Mater" University Complex for the Humanities at Sofia University "Saint Kliment Ohridski".
References
- Management Plan 2016-2025, Central Balkan National Park. http://visitcentralbalkan.net/assets/userfiles/file/Administration/APU_CBNP_2016-2025_ENG.pdf. Accessed on: 2017-2-22.
- Research of the Biotope Diversity for the Purposes of Economic Valuation of Ecosystem Services in Chepelare Municipality (The Rhodopes Region of Bulgaria).European Journal of Sustainable Development5(4):409‑420. https://doi.org/10.14207/ejsd.2016.v5n4p409
- Understanding relationships among multiple ecosystem services.Ecology Letters12:1394‑1404. https://doi.org/10.1111/j.1461-0248.2009.01387.x
- TEEB follow-up study for Europe.
- Our Life Insurance, Our Natural Capital: An EU Biodiversity Strategy to 2020.
- The value of the world's ecosystem services and natural capital.Nature387:253‑260. https://doi.org/10.1038/387253a0
- Challenges in integrating the concept of ecosystem services and values in landscape planning, management and decision making.Ecological Complexity7:260‑272. https://doi.org/10.1016/j.ecocom.2009.10.006
- Valuation of ecosystem services provided by forests of Central Balkan National Park.Operational Program “Environment 2007–2013”.
- Agrostatistical Reference Book 2000-2014.Ministry of Agriculture and Food, Republic of Bulgaria.online edition,Sofia. URL: http://www.mzh.government.bg/MZH/en/ShortLinks/SelskaPolitika/Agrostatistics.aspx
- The history of ecosystem services in economic theory and practice: From early notions to markets and payment schemes.Ecological Economics69(6):1209‑1218. https://doi.org/10.1016/j.ecolecon.2009.11.007
- Synergies, trade-offs, and losses of ecosystem services in urban regions: an integrated multiscale framework applied to the Leipzig-Halle region, Germany.Ecology and Society17(3):22.
- CICES V4.3 - Report prepared following consultation on CICES Version 4. August-December 2012.EEA Framework Contract No EEA/IEA/09/003.
- Mapping ecosystem services: an integrated biophysical and economic evaluation.YSSP Interim Report IR-14-007, International Institute for Applied Systems Analysis, Austria.
- GIS-based Valuation of Ecosystem Services in Mountain Regions: A Case Study of the Chepelare Municipality in Bulgaria.European Journal of Sustainable Development5(4):335‑346. https://doi.org/10.14207/ejsd.2016.v5n4p335
- Ecosystem Services. Global Issues, Local Practices.Elsevier,456pp. [InEnglish]. [ISBN978-0-12-419964-4]
- Benefit transfer of environmental and resource values: A handbook for researchers and practitioners.Springer[ISBN978-94-017-9929-4]
- Plan for Development of the Karlovo Municipality for 2014-2020. http://www.karlovo.bg/bg/. Accessed on: 2017-2-22.
- http://www.karlovo.bg/. Accessed on: 2017-2-22.
- TEEB: The Economics of Ecosystems and Biodiversity. Ecological and Economic Foundations.Earthscan, London and Washington[InEnglish]. URL: http://www.teebweb.org/our-publications/teeb-study-reports/ecological-and-economic-foundations/
- An analytical framework for ecosystem assessments under Action 5 of the EU Biodiversity Strategy to 2020. http://ec.europa.eu/environment/nature/knowledge/ecosystem_assessment/pdf/MAESWorkingPaper2013.pdf. Accessed on: 2017-2-22.
- Indicators for ecosystem assessments under Action 5 of the EU Biodiversity Strategy to 2020. http://catalogue.biodiversity.europa.eu/uploads/document/file/1230/2ndMAESWorkingPaper.pdf. Accessed on: 2017-2-22.
- Results of the Agricultural Farms Tally in 2010. http://www.mzh.government.bg. Accessed on: 2017-2-22.
- National ecological network NATURA 2000, Ministry of Environment and Waters, Republic of Bulgaria. URL: http://natura2000.moew.government.bg/Home/Natura2000ProtectedSites
- Biodiversity, Ecosystem Functioning, and Human Wellbeing: An Ecological and Economic Perspective.Oxford University Press,Oxford, UK.
- http://eea.government.bg/bg/projects/korine-14/kzp-danni-clc-data. Accessed on: 2017-2-22.
- Prices of agricultural production data series. URL: http://www.nsi.bg/en/content/4247/prices-agricultural-production-data-series
- Regional statistics data series. URL: http://www.nsi.bg/en/content/11252/regional-statistics-and-indicators-monitoring
- Demography.
- Routledge Handbook of Ecosystem Services. Routledge.Routledge,658pp. [InEnglish]. [ISBN9781317687030]
- Spatial interactions among ecosystem services in an urbanizing agricultural watershed.PNAS110(29):12149‑12154. [InEnglish]. https://doi.org/10.1073/pnas.1310539110
- Ecosystem service bundles for analyzing tradeoffs in diverse landscapes.Proceedings of the National Acadamy of Science, PNAS107(11):5242‑5247. [InEnglish]. https://doi.org/10.1073/pnas.0907284107
- Linking Land Cover Data and Crop Yields for Mapping and Assessment of Pollination Services in Europe.Land2:472‑492. [InEnglish]. https://doi.org/10.3390/land2030472