|
One Ecosystem : Research Article
|
|
Corresponding author: Karsten Grunewald (k.grunewald@ioer.de)
Academic editor: Miglena Zhiyanski
Received: 06 Jun 2017 | Accepted: 04 Jul 2017 | Published: 06 Jul 2017
© 2017 Karsten Grunewald, Ralf-Uwe Syrbe, Ulrich Walz, Benjamin Richter, Gotthard Meinel, Hendrik Herold, Stefan Marzelli
This is an open access article distributed under the terms of the Creative Commons Attribution License (CC BY 4.0), which permits unrestricted use, distribution, and reproduction in any medium, provided the original author and source are credited.
Citation: Grunewald K, Syrbe R, Walz U, Richter B, Meinel G, Herold H, Marzelli S (2017) Germany’s Ecosystem Services – State of the Indicator Development for a Nationwide Assessment and Monitoring. One Ecosystem 2: e14021. https://doi.org/10.3897/oneeco.2.e14021
|
|
Abstract
The obligations of the EU Biodiversity Strategy 2020 are generating a need to create national maps and monitoring systems for the state of biodiversity and ecosystem services (ES) on the basis of indicators. The paper gives an overview of the ecosystem services indicators being developed for Germany in the context of ongoing research projects. Additionally, it provides the indicator specifications, which are aligned with the EU MAES framework concepts (initiative on Mapping and Assessment of Ecosystems and their Services).
We illustrate aspects of data selection, calculation and negotiation procedures, results and target values in general and by way of examples. The German indicator-based approach presents measures and sums up ES in their spatial expression and temporal change and compares them with objectives. As far as possible, this is carried out according to the demand-supply concept. A prioritization of ES classes to be processed was carried out in the framework of an expert-based assessment. The results indicated that 21 of the 48 CICES classes (Common International Classification of Ecosystem Services) were most relevant for Germany in recent years. We proposed a total of 51 indicators, of which 14 indicators for 4 ES classes were accepted, implemented and published by the end of 2016. The development of ES maps and the indicator-based assessment on a national scale is a process. Consequently, the necessary further steps are shown.
Keywords
Biodiversity; CICES-classification; ecosystem condition; flood protection; MAES-framework; soil erosion; urban green space; wood accrual
Introduction
Ecosystems contribute to human well-being in many ways (
The nationwide mapping and assessment of ES can be seen as part of a National Ecosystem Assessment (NEA) and is essential to understanding how ecosystems contribute to human well-being and to supporting decisions on policies which have an impact on natural resources (
In Germany, the Federal Ministry for the Environment, Nature Conservation, Building and Nuclear Safety (Environment Ministry, BMUB) and the Federal Agency for Nature Conservation (BfN) commissioned several research projects to address the requests made in the MAES context (
In parallel, the project “Natural Capital Germany – TEEB-DE” (www.naturkapitalteeb.de), supported by a broad community, was realized and completed in 2017. It was intended to make the services and values of nature more visible to German population and to develop proposals for how natural capital can be better integrated into private and public decision-making processes. However, a systematic analysis and mapping of ES at the national level (quantitative, reproducible) was not planned in this project.
Scientifically credible, practically relevant, and politically legitimate indicators are seen as key for a nationwide assessment of ecosystems and their services. In order to operationalize and present such indicators cartographically, they must be formalized and derived in terms of a basic spatial unit. In general, these are 1 km² grid fields (see CICES- and SEEA-Systems, Hein et al., 2016). The geo-spatial interpretation of indicators necessarily involves the simultaneous analysis of related aspects of spatial structure or processes with a spatial impact (e.g., www.IOER-monitor.de). This applies to basic data (land use, soil, population, etc.), administrative units (municipality, district, federal state) as well as figuring the results in maps. National ES indicators are indices which have a high level of aggregation and are mainly used for the strategy level. Furthermore, the indicators should have the following profile (
- The indicators should be relevant to environmental and nature-protection policies and further sectoral policies, i.e. maps and assessments should be generated to make the significance of the services of nature for humans visible.
- The ES indicators should be analytically clean, i.e. secured according to the current theoretical, scientific-technical knowledge and international standards, but also simple, repeatedly measurable and reproducible, practical, easy to interpret and spatially resolved for Germany, and should indicate trends over time.
- They should form a basis for international comparisons and enable an implementation of the ES approach with reference to the EU Biodiversity Strategy.
A national inventory of ecosystems and their services for Germany in the sense of a NEA-DE (
Such cross-media environmental assessment on ecosystem and landscape level presents a new part of the environmental reporting system. MAES-DE indicators are planned to inform different policies, e.g. agriculture, forestry, tourism, traffic planning, spatial planning, climate change mitigation and adaption, flood control, water quality, fresh water supply, air quality, etc. Additionally, MAES-indicators can become a nationwide data base for enhanced landscape planning. Landscape planning in Germany is a sectoral environmental planning with the aim to conserve and develop ecosystems to provide healthy living conditions, recreation opportunities and habitats for flora and fauna (
In the second step we explain for the three categories of final ES (provisioning, regulating, cultural ES) the processed ES classes with proposed national indicators. To become part of other existing official environmental indicator systems, the MAES indicators will have to go through additional negotiation processes with other ministries in the follow-up. Here ‘relevance’ and ‘acceptance’ are important criteria. Practical implementation is briefly illustrated on the basis of concrete examples. This includes particularly the template of indicator description, calculation steps and interpretation of results. In the latter, the focus is placed on the relationship between ES indicators and biodiversity, as the indicator development takes place within the scope of the EU Biodiversity Strategy 2020. Finally, we summarize first results and show the monitoring concept as well as the steps ahead.
Methodological framework and target category ES indicators
A scoping study proposed first national ES indicators and provided example maps based on existing data (
Today, perhaps surprisingly, no comprehensive ‘Ecosystem Type Map’ for Germany is available, which should be provided for module (1). The development is only at the methodological stage now. The current situation regarding MEAS-DE data in Germany is as follows:
It is recommended that EU member states use CORINE Land Cover data (CLC,
The Official Topographic-Cartographic Information System ATKIS is the base information system of the Federal Republic of Germany for digital topographical geodata. It consists of digital landscape models (Basic-DLM), digital terrain models (DGM), digital topographic maps (DTK) as well as digital ortho-photos (DOP). The scope of information of the basic landscape model is oriented according to the contents of topographic maps 1:25,000. There is an object-type catalogue with the categories: settlement, transportation, vegetation, water, relief and terrain. Generalized object types of Basic-DLM are shown in Fig.
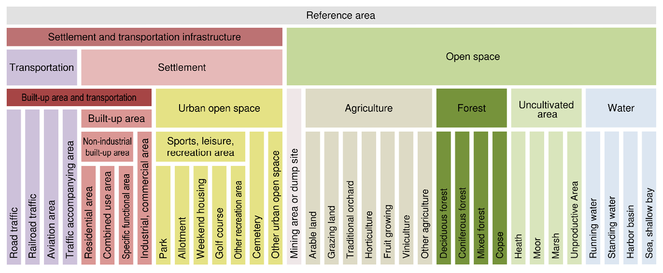
Generalized object types of Basic-DLM (Source: www.ioer-monitor.de)
In order to produce a data set with the CORINE classification and a higher spatial resolution than CORINE (1:100.000), the Federal Agency for Cartography and Geodesy (Bundesamt für Kartographie und Geodäsie, BKG) has developed the digital land cover model for Germany (Landbedeckungsmodell Deutschland, LBM-DE) in cooperation with the Federal Environmental Agency (Umweltbundesamt, UBA) (
Besides the ATKIS information further nationwide data sets (selection), which were used for ES-mapping and assessment:
- Additional spatial data sets are soil maps (particularly the topsoils map 1:1,000,000 of the Federal Institute for Geosciences and Natural Resources,
BGR 2016 ), mapping of inundation areas, nitrate exposure modeling, elevation models, erosion modeling, ground waterbodies, groundwater infiltration rates, groundwater quality (Nitrate Directive monitoring points), number of inhabitants per 100m2, suitability of land-use mix for recreation. - Additional statistical data per city and county (German: „kreisfreie Stadt” and „Kreis”; Germany consists of 401 counties – “Kreise” and independent cities – “kreisfreie Städte”) on nitrate surplus, freshwater extraction from groundwater and running water, water use.
- Additional point sources that provide a representative picture for Germany and each of the 16 federal states (Bundesländer): farmland ecosystems with high nature value, national forest inventory.
- Reporting data for WFD (Water Framework Directive) and Natura 2000 with rather low spatial resolutions.
- Additional national indicators from the national biodiversity strategies, e.g. bird population index.
Meanwhile, the European Environment Agency has presented a concept for capturing the condition of ecosystems (module 2) that should be the basis for analyzing the relationships between ecosystem condition and ES, since a Europe-wide harmonized approach is desired (
Indicators for assessing ES (module 3) can be directed at different quantities: e.g. the current flow of ES, nature’s potential to provide ES or the demand or need for ES. The basis of the service is material and thus basically measurable. An exception is the group of intangible values for cultural ES. Usually, several service providers can be identified for a final ES (
In the context of past research projects (e.g. TEEB-DE;
In order to adapt the German economy and society to a sustainable development path in keeping with the ecosystems’ capacities, the ES must be integrated into economic accountings. The implementation of the EU Biodiversity Strategy requires this by 2020 (
Developing indicators for ecosystem services at the federal level
In the framework of the BfN research project “TEEB Germany Overview Study” (“TEEB Deutschland Übersichtsstudie”) completed in 2014, the possibilities of capturing ES in Germany at the federal level were examined (
The BfN/BMUB research project “Implementation of Action 5 of the EU Biodiversity Strategy - Development and implementation of a methodology for capturing and assessing ecosystem services at the federal level in the context of the implementation of Target 2 and Action 5 of the EU Biodiversity Strategy for 2020” (2014-2016, research participants: IOER Dresden/ifuplan Munich) was initiated for this purpose. In addition to the further development of the concept and the implementation, some initial selected ES indicators were to be integrated into the “Monitor of Settlement and Open Space Development (IOER Monitor)”, for which the IOER provides basic funding. The research work was in consultation BfN/IOER focused on 21 priority ES classes, and principles for describing indicandum (ES) and indicator were developed (
Overview of the state of implementation
Of the indicators with particularly high priority by the contracting authority (BfN), prototypes have been developed for four ES classes so far, which are largely harmonized and accepted (Table
Selected ecosystem services for which nationwide indicators were implemented in Germany (as of December 13, 2016)
|
ES class according to CICES (modifications or further divisions in brackets) |
Indicators* with average value of an ES for all of Germany (year) |
|
Fibres and other materials from plants, algae and animals for direct use or processing (forest wood material) |
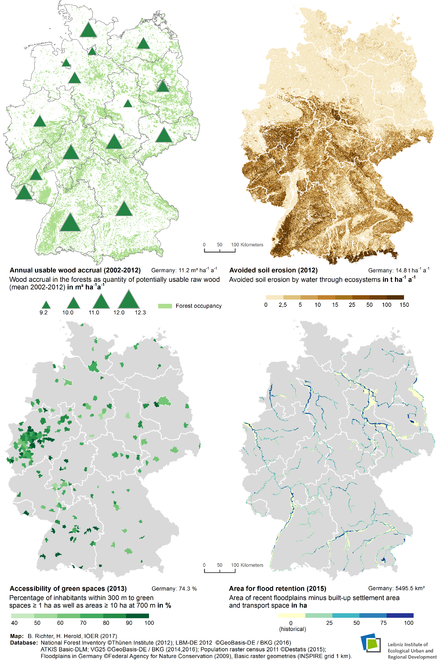
M Annual usable wood accrual: 11.2 m3 ha-1 a-1 (mean value 2002-2012) S1 Forest area: 11,419,124 ha (2015) S2 Wood stock 2012 referred to the forest area: 336 m³ ha-1 S3 Development of the annual logging and wood utilization: 40.2 million tons (2013) S4 Change in wood stock as balance of growth and extraction: increase of 106.6% (2002-2012) S5 Proportion of near-natural forest areas 15% natural; 22% near-natural (2012) S6 Proportion of unfragmented forests > 50 km² in reference area: 3.5% (2014) |
|
Flood protection |
M Area for flood retention: 547,550 ha (2015) S Proportion of built-up areas in the current floodplain: 3.9 % (22,076 ha) in 2015 |
|
Mass stabilization and control of erosion rates |
M Avoided water erosion: 14.8 t ha-1 a-1 (2012) S1 Actual water erosion: 1.4 t ha-1 a-1 (2012) S2 Water erosion avoided by small landscape structures: 0.5 t ha-1 a-1 (2012) S3 Proportion of organic farming: 1.9% of arable land (2012) |
|
Experiential use of plants, animals and land-/seascapes and physical use of land-/seascapes in different environmental settings (in this case we combined two CICES-classes) |
M Accessibility of green spaces: 74.3% of city dwellers (2013), calculated for all cities ≥ 50,000 inhabitants S Green-space provision per inhabitant related to total amount of green space: 250 m² (2013) |
* M – Main indicator, S – Supplementary indicator
The remaining indicators are still being developed (Table
Proposed nationwide ES indicators, which are still under development and negotiation (selection of ES-classes: cf.
|
ES class (according to CICES) |
Indicators (first pre-proposal) |
|
Groundwater for drinking |
M proportion of drinking water extracted (from groundwater) with respect to newly formed groundwater |
|
Cultivated crops |
M Change in yield potential S1 Harvest statistics grain units S2 Proportion of agricultural area S3 Proportion of organic farming |
|
Reared animals and their outputs |
M Stocking density (administrative area) S1 Stocking density (agricultural area) S2 Animal nitrogen fertilizer |
|
Materials from plants, algae and animals for agricultural use |
M Grassland area S Grassland area (agricultural area) |
|
Plant-based resources |
M Area for cultivating non-wood energy crops |
|
Filtration/sequestration/storage/accumulation by ecosystems |
M Protection potential of the groundwater cover (zone of aeration) S1 Nitrate pollution of groundwater S2 Extraction of drinking water from groundwater S3 Superposition of demand from GW aquifers of different levels of protection potential |
|
Dilution by atmosphere, freshwater and marine ecosystems |
M Proportion of waterbodies with good hydromorphological state S1 Biological water quality S2 Demand through use of drinking water S3 Demand by residents for recreational use S4 Chemical state of the surface waters |
|
Pollination and seed dispersal |
M Pollination potential S1 Bee colonies in Germany S2 Yield of tree fruits |
|
Global climate regulation by reduction of greenhouse gas concentrations |
M Annual net effect of ecosystems S1 Absolute value of the CO2 stock S2 Index of the change in CO2 stock |
|
Ventilation and transpiration; Micro and regional climate regulation (we combined these two CICES-classes for practical reasons) |
M Specific green volume S Population density / degree of sealing |
|
Chemical condition of freshwaters |
M1 Denitrification in the waterbody M2 Phosphorus retention in the waterbody |
|
Pest control |
M Density of small-scale structures in farmland or in specialty crops |
|
Maintaining nursery populations and habitats |
M Main areas of distribution with cultured species of related wild plants |
|
Experiential use of plants, animals and land-/seascapes in different environmental settings |
M Agricultural potential for leisure-time, daily and weekend recreation |
|
Aesthetics |
M Aesthetic value of the landscapes |
|
Existence value |
M Landscape diversity |
Exemplary indicator specification for provisioning ES (forest wood material)
Provisioning services such as food, wood and drinking water rightly rank first among the ES, as human existence is impossible without them. However, since the end of the hunter-gatherer period the main quantity of food, for example, has not come from near-natural ecosystems, but from agriculture (agroecosystems). Increasingly, “non-natural” production systems for plants and animals have been created, which have been ethically justified with reference to the increase in population and competition for land and have continuously been perfected (
From the category of the supply ES, the class “Fibres and other materials from plants, algae and animals for direct use or processin” with the main indicator “annual usable wood accrual” and six secondary indicators was realized (Table
Synthesis of the main indicators implemented so far
|
Indicator |
Spatial approach * |
Time periods (to date and prospective next period in brackets) |
First trend GER** |
Assessment of the service provision |
|||||
|
IN |
GER |
FS |
DISTR |
MUN |
GR |
||||
|
Annual usable wood accrual |
x |
x |
x |
2002-2012 (2022) |
3 |
||||
|
Area for flood retention |
x |
x |
x |
x |
x |
x |
2010-2015 (2020) |
2-3 |
|
|
Avoided water erosion |
x |
x |
x |
x |
x |
2009-2012 (2015) |
2 |
||
|
Accessibility of urban green spaces |
x |
x |
x |
x |
2008-2013-2015 (2018) |
2-3 |
|||
* IN-international, GER-Germany, FS-federal state, DISTR-district, MUN-municipality, GR-grid
** Assessment scale: 0-cannot be assessed, 1-falling, 2-slightly decreasing, 3-constant, 4-slightly increasing, 5-strongly increasing
In principle, it should be noted that the provision of ES does not occur individually and independently but often entire bundles of ES are affected by decisions on use (keyword multifunctionality; e.g. forest as a provider of building materials or fuel, but also as an important carbon and water storage or recreation area) and that the quantification of provisioning ES is not about an increase in the quantity of goods or services from the ecosystems but about sustainable approaches for use.
The assessment of a provisioning service usually does not provide any information on the ecosystem condition or the biodiversity. For the main indicator “annual usable wood accrual”, values between 9 and 12 m3 ha-1 a-1 were determined for the federal states (mean for Germany 11.2 m3 ha-1 a-1, Table
Exemplary indicator specification for regulating ES (erosion, flood protection)
Regulating ES are closely coupled to the state of the environment and usually positively correlated with greater biodiversity, e.g. flood control in floodplains and renaturalization of floodplains or mitigation of CO2 emissions through peatland renaturalization and each lead to a better state of biodiversity. The clean distinction between indicators of the ecosystem condition and service indicators as well as the representation of dependencies and interactions are particular challenges in this area. In this respect, too, the CICES classification is not always sufficiently clear (e.g., ES class “Chemical condition of freshwaters”).
Out of this category, the classes “flood protection” and “mass stabilization and control of erosion rates” have been implemented so far (Table
In addition to the area size, flood retention is particularly dependent on the volume of the retention areas and the (distribution of the) flow velocity (valley floor gradient, damming “obstacles”, among others). Reliable statements on the actual flood retention of floodplains can only be made using modeling technology, which is currently not feasible with reasonable effort on a federal level. The BfN has therefore so far eschewed a nationwide determination of the flood retention capacity. Consequently, two simplified indicators for measuring the potential flood retention at the federal level were proposed, coordinated and implemented (Table
Although the actual service consists in the protective effect against soil loss, the amount of average soil loss can also be an indicator for erosion regulation service as the areas with high amount represent low erosion regulation supply. But this is not applicable vice versa since a low amount is also calculated for paved surfaces without a real service. In order to determine this protective effect, a reference value as stable as possible must be known (i.e. a maximum or mean erosion), which can be used for measuring the (positive) service. The hypothetical erosion in the case of open soil and a standard surface area size can be considered as a reference value; the protective service of the ecosystem then consists of the difference between possible and current erosion (
Exemplary indicator specification for cultural ES (green-space access in cities)
Cultural and socio-cultural ES are the immaterial values and the use that people attribute to or derive from ecosystems. These hardly measurable features lead to the cultural ES being the least operationalized so far. However, qualitative assessments of landscape qualities are useful (e.g.,
According to the CICES classification (
The BfN has been defined to focus the work within the framework of Action 5 of the EU Biodiversity Strategy 2020 in Germany on the functions of the landscape for nature experience, recreational activities and aesthetics (
The assessment of the ecosystem service “recreation in the city” showed that for 74.3% of the inhabitants from the 182 cities studied (all cities ≥ 50,000 inhabitants), green spaces and water areas (≥ 1ha) were reachable at a linear distance of 300 m (≈ 500 m walking distance) as well as green spaces and water areas (≥10 ha) at a linear distance of 700 m (≈ 1,000 m walking distance). The individual cities can make comparisons among themselves and learn about their deviation from the mean or target value – the BfN proposes a target value of 95% by 2020. Not only this indicator shows that the results depend on the methods chosen, the data used, the stipulations made and the connections drawn, and that any interpretation should thus be cautious (
The ES indicator “Accessibility of green spaces” is also proposed for the German National Strategy on Biological Diversity (Nationale Strategie zur Biologischen Vielfalt, NBS). The ES indicator can underpin this NBS target as a measurement and monitoring quantity. The indicator is selected to address the aims of increasing the percentage of green areas and structures, linking them and pursuing a qualified brownfield development of settlements as well as reducing land use (
First Synthesis
The German MAES process is still ongoing. A draft with a first nationwide trend analysis of ecosystem services combined with an assessment will be available at the end of 2017. MAES indicators in Germany are planned to become part of sets of other national environmental indicators that are monitored regularly. The ES indicators developed and implemented so far were mostly represented spatially in maps as well temporarily in their development trend (Table
The indicators provide insights into the values and resilience of nature in Germany with respect to individual aspects, in different dimensions and with spatiotemporal specificity. In the desired aggregate (more complete set of ES indicators) also a more comprehensively and systematically assessment is aspired. In the best case, not only trends and priority areas but also requirements, consequences of action and load limits become apparent. This explicitly occurs against the background of functioning ecosystems and for the purpose of conserving biodiversity. Whether we can point to a “safe scope of action” for using natural resources in which growth is possible and change/limitation is necessary, requires further in-depth work and discussions.
The work so far allows the following further assessments and qualifications:
- The assignment of indicators and CICES classes is not always one-to-one (several indicators are possible for one ES class, and on the other hand one indicator can sometimes be assigned to different ES classes).
- The demand side (for example, the need for green areas in the city, woodcutting, flood protection) is considered a characteristic for the relationship between social needs and ecosystem change (responsiveness to changing needs) – but the relationship is difficult to represent. So far we have been trying to capture the intensity of the demand for ES.
- ES indicators are always a simplification of reality / complexity and there is no sure formula as to whether many indicators should be developed in order to represent the complexity or only few indicators (indexing) in order to focus practice and policy-making on the “essentials”. Accordingly, they cannot be taken alone as a guideline for political or practical decisions.
- It is a considerable challenge to simultaneously fulfil the indicator requirements from an environmental policy view (intuitive and comprehensible, coherent, cross-media, polluter-specific, adjustable, long-term), an economic policy view (in particular, they should allow scope for design and action, indicate solution ranges) and a specialist view (see above). Accordingly, it is necessary to strike compromises.
- It must always be critically reflected what the indicators “indicate” for whom and what societal goals are associated with an indicator. Not the indicator but the indicandum is of real interest, i.e. the indicated, not directly measurable and often complex issue or condition/service and its changes.
Conclusion
In accordance with the requirements of the EU Biodiversity Strategy 2020, a system of national initial capture of ES for Germany was developed and coordinated. The representation of selected ES using indicators allows an overview and guarantees reporting (e.g. to the EU) and the use of first results for different purposes (e.g. via the IOER Monitor). However, this does not yet fulfil the intention of the ES concept to serve as an operative instrument for a sustainable development. The establishment and legitimation of the ES indicators is still at an early stage in Germany. In the long and medium term we therefore recommend from a scientific perspective:
- Continuing the work, started especially with regard to a NEA-DE and as a prerequisite for successful IPBES work (see section 1): development, implementation and coordination of a more complete ES indicator set;
- Maintenance: keeping indicators current, updating them (regular data analyses, interpretations) and recalculating them (time series, monitoring); including further development and reporting with regard to target deviation (validation of normative specifications, negotiation of societally desired conditions and developments). Competences, legal aspects, standards, GIS routines etc. for keeping and maintaining data and reimbursements need to be clarified.
- Complementary contributions: Supplementary surveys on selected indicators of the ecosystem condition are required, inter alia pointing out the connections/interactions between conditions, services and biodiversity features of the most important ecosystem types including steering possibilities for policy-makers and nature conservation experts.
- Communication: communicating the results to the EU (via MAES working group) and policy fields (provision/communication of strategy-supporting visions and emotions), decision-makers and the public (e.g., costs of damage prevention, health potentials); further cooperation with affected/relevant ministries, in particular at the federal level. Coordination of these interdisciplinary tasks at the intersection of science and policy-making (institutional framework required).
Aiming at implementation: It would be desirable to use the coordinated ES indicators as a measurement and steering instrument for sustainable development at the national level e.g. with a view to concrete planning cases or integration of ES into the national resource policies. This need, however, a balancing of opportunities and risks.
References
-
Landscape and well-being: a scoping study on the health-promoting impact of outdoor environments.Int J Public Health55(1):59‑69. https://doi.org/10.1007/s00038-009-0069-z
-
Erfassung und Bewertung von kulturellen Ökosystemleistungen in Deutschland. Ein Forschungsprojekt mit Fokus auf Feierabend- und Wochenenderholung.In: Naturschutz BB (Ed.)Verantwortung für die Zukunft – Naturschutz im Spannungsfeld gesellschaftlicher Interessen.DNT-Journal,Bonn.
-
Development of National Indicators for Ecosystem Services Recommendations for Germany.Discussion Paper411URL: https://www.bfn.de/fileadmin/BfN/service/Dokumente/skripten/skript411.pdf
-
Towards a National Ecosystem Assessment in Germany: A Plea for a Comprehensive Approach.GAIA - Ecological Perspectives for Science and Society26(1):27‑33. https://doi.org/10.14512/gaia.26.1.8
-
Karte der Bodenarten in Oberböden 1:1.000.000 [Map of topsoils] (BOART1000OB).http://www.bgr.bund.de/DE/Themen/Boden/Informationsgrundlagen/Bodenkundliche_Karten_Datenbanken/Themenkarten/BOART1000OB/boart1000ob_node.html. Accessed on: 2016-5-31.
-
Indicator report 2010 to the National Strategy on Biological Diversity. Federal Ministry for the Environment, Nature Conservation and Nuclear Safety (BMU). http://www.biologischevielfalt.de/fileadmin/NBS/indikatoren/Indicator_Report_2010_NBS_Web.pdf. Accessed on: 2016-12-12.
-
A synthesis of approaches to assess and value ecosystem services in the EU in the context of TEEB. Final Report.University of Amsterdam, Institute for Environmental Studies
-
Handbook of Ecosystem Services Mapping.Pensoft
-
Ecosystem Service Potentials, Flows and Demands – Concepts for Spatial Localisation, Indication and Quantification.Landscape OnlineV/34:1‑32. https://doi.org/10.3097/LO.201434
-
Our life insurance, our natural capital: An EU biodiversity strategy to 2020. Communication from the Commission to the European Parliament, the Council the Economic and Social Committee and the Committee of the Regions.COM 244 final.
-
Ökosysteme und ihre Leistungen erfassen und räumlich darstellen. http://www.econcept.ch/uploads/media/Schlussbericht_Oekosysteme_Leistungen_erfassen_raeumlich-darstellen.pdf. Accessed on: 2016-4-08.
-
CLC2006 technical guidelines. EEA Technical report No. 17/2007. http://www.eea.europa.eu/publications/technical_report_2007_17. Accessed on: 2016-4-08.
-
SOER 2015 -The European environment - state and outlook 2015. European briefings. Natural capital and ecosystem services. https://www.eea.europa.eu/soer. Accessed on: 2017-5-17.
-
Digital Basic Landscape Model (AAA Modelling): Basis-DLM (AAA). http://www.geodatenzentrum.de/docpdf/basis-dlm-aaa_eng.pdf. Accessed on: 2017-5-23.
-
A contribution towards a transfer of the ecosystem service concept to landscape planning using landscape metrics.Ecol. Indicators21:30‑38. https://doi.org/10.1016/j.ecolind.2011.04.027
-
Ecosystem Services. Concept, Methods and Case Studies.Springer
-
Proposal of indicators regarding the provision and accessibility of green spaces for assessing the ecosystem service “recreation in the city” in Germany.International Journal of Biodiversity Science, Ecosystem Services & Management13(2):26‑39. https://doi.org/10.1080/21513732.2017.1283361
-
Assessment of ecosystem services at the national level in Germany – illustration of the concept and the development of indicators by way of the example wood provision.Ecol. Indicators70:181‑195. https://doi.org/10.1016/j.ecolind.2016.06.010
-
Landschaftsplanung.Ulmer/UTB
-
Nachhaltiges Landmanagement, differenzierte Landnutzung und Klimaschutz.Band 16.FAGUS-Schriftenreihe,TU Berlin.
-
Common International Classification of Ecosystem Services (CICES): Consultation on Version 4. www.cices.eu and a full spread sheet showing the classification. Accessed on: 2015-1-15.
-
Defining Ecosystem Assets for Natural Capital Accounting.PLOS ONE11(11):e0164460. https://doi.org/10.1371/journal.pone.0164460
-
Digital land cover model for Germany–DLM-DE. In: Manakos I, Braun M (Eds)Land Use and Land Cover Mapping in Europe: Practices & Trends. Remote Sensing and Digital Image Processing 18.Springer
-
Towards A Sustainable and Genuinely Green Economy. The value and social significance of ecosystem services in Finland.TEEB FinlandURL: https://helda.helsinki.fi/handle/10138/152815
-
Mapping and Assessment of Ecosystems and their Services. Indicators for ecosystem assessments under Action 5 of the EU Biodiversity Strategy to 2020.– Final080. URL: http://ec.europa.eu/environment/nature/knowledge/ecosystem_assessment/pdf/2ndMAESWorkingPaper.pdf
-
Mapping and Assessment of Ecosystems and their Services. An analytical framework for ecosystem assessments under action 5 of the EU biodiversity strategy to 2020.Technical Report - 2013 – 067, Publications office of the European Union, Luxembourg. http://ec.europa.eu/environment/nature/knowledge/ecosystem_assessment/pdf/MAESWorkingPaper2013.pdf. Accessed on: 2015-1-20.
-
Die Erfassung von Ökosystemleistungen. Erste Schritte für eine Nutzung des Konzepts auf nationaler Ebene für Deutschland.Natur und Landschaft89:66‑73.
-
Ecosystems and human well-being. Synthesis. Island Press, Washington DC. http://www.millenniumassessment.org/documents/document.356.aspx.pdf. Accessed on: 2016-4-08.
-
Mapping cultural ecosystem services: A framework to assess the potential for outdoor recreation across the EU.Ecol. Indicators45:371‑385. https://doi.org/10.1016/j.ecolind.2014.04.018
-
National Ecosystem Assessments in Europe: A Review.BioSciencebiw101. https://doi.org/10.1093/biosci/biw101
-
Indikatoren für Ökosystemdienstleistungen: Systematik, Methodik und Umsetzungsempfehlung für eine wohlfahrtsbezogene Umweltberichterstattung. http://www.bafu.admin.ch/publikationen/publikation/01587/index.html?lang=de. Accessed on: 2016-4-08.
-
Indicators of a nationwide monitoring of ecosystem services exemplified by the mitigation of water erosion.Ecol. Indicators[Inaccepted].
-
What to map?In: Burkhard B, Maes J (Eds)Ecosystem Services Mapping.Pensoft
-
Cultural ecosystem services in the UK: Lessons on designing indicators to inform management and policy.Ecol. Indicators61(1):63‑73. https://doi.org/10.1016/j.ecolind.2015.03.040
-
Indikatoren zur „Regulationsleistung von Auen“ - Ein Beitrag zum Konzept nationale Ökosystemleistungs-Indikatoren Deutschland.Naturschutz und Landschaftsplanung49(3):93‑100.