|
One Ecosystem :
Ecosystem Service Mapping
|
|
Corresponding author: Floriane Jacquemin (floriane_jacquemin@hotmail.com)
Academic editor: Bilyana Borisova
Received: 17 May 2017 | Accepted: 12 Jul 2017 | Published: 26 Jul 2017
© 2017 Floriane Jacquemin, Cyrille Violle, Pierre Rasmont, Marc Dufrêne
This is an open access article distributed under the terms of the Creative Commons Attribution License (CC BY 4.0), which permits unrestricted use, distribution, and reproduction in any medium, provided the original author and source are credited.
Citation:
Jacquemin F, Violle C, Rasmont P, Dufrêne M (2017) Mapping the dependency of crops on pollinators in Belgium. One Ecosystem 2: e13738. https://doi.org/10.3897/oneeco.2.e13738
|
|
Abstract
Background
Because of their pollinating activity, insect pollinators provide an ecosystem service that is essential to ecosystems and our economy. A large majority of the flowering plants we consume depends on it. In turn, the decline in pollinators observed for the last decades in Belgium as in many other European countries threatens agriculture and human well-being.
New information
Here we evaluate the pollination service at a country-wide scale through the estimated value of the contribution of insect pollination to the production used for human consumption in Belgium using crop dependency ratios. We then mapped the vulnerability of crops in the face of pollinator decline at the provincial level.
We show that the part of plant production for human food that we can attribute to the action of insect pollinators represents a value of about 251.6 million euros in 2010 in Belgium. As a result, 11.1 % of total value of Belgian plant production (in terms of fruit quantity and quality) depend on pollinators.
Although the applied method to assess the pollination service estimates only a minimum value of a single aspect of the pollination service, it allows to target the areas of the country where this service is particularly at risk and where it is necessary to define pollinator conservation measures to maintain, and possibly restore current yields.
Keywords
Crop, biodiversity, pollination service, dependency ratio, vulnerability index.
Introduction
More than 80% of flowering plant species in the world depend on pollinators, especially insects (mainly from Lepidoptera, Coleoptera, Diptera and Hymenoptera genera) to ensure their reproduction (
By pollinating wild and cultivated plant species (
Many countries worldwide have encountered an overall loss of their wild pollinators for the last decades (
As a result, the decline in pollinators threatens the pollination service they offer (
The objective of this study is to evaluate the contribution of pollinators to Belgian crop production for human consumption so as to figure out how threatened it is depending on the area. This also makes it possible to discuss the relevance of certain agri-environmental measures taking into account these dependency relationships between crops and pollinators.
Materials and Methods
Methods
Our evaluation of the pollination service is based on a methodology established on a global scale by
Based on this method, the economic value of the pollination service is estimated by the contribution of pollinators to the market value of Belgian crop production intended for human consumption (
\(PEV = \sum_{i=1}^{I}\sum_{j=1}^{J} P_{ij} \times Q_{ij} \)
Function 1. Total production economic value (€).
\(IPEV = \sum_{i=1}^{I} \sum_{j=1}^{J} P_{ij} \times Q_{ij} \times D_{i}\)
Function 2. Insect pollination economic value (€).
\(RV = {IPEV \over PEV}\)
Function 3. Rate of vulnerability of crops (%) to pollinator insect disappearance.
Results and discussion
The results obtained by crop category at the national scale for the reference year 2010 are listed in Table
Total value of crop production (PEV, €), pollination service (IPEV, €) and vulnerability (RV, %) of crop categories used as human food in Belgium in 2010.
|
Crop category |
Total value of crop production (PEV, million €) |
Total value of pollination service (IPEV, million €) |
Vulnerability index (RV, %) |
|
Cereals |
476.88 |
0.00 |
0.00 |
|
Fruits |
320.41 |
205.27 |
64.06 |
|
Oilcrops |
6.06 |
1.82 |
30.00 |
|
Pulse |
1.57 |
0.17 |
10.97 |
|
Roots and Tubers |
409.12 |
0.00 |
0.00 |
|
Stimulant crops |
0.26 |
0.00 |
0.00 |
|
Sugar crops |
119.21 |
0.00 |
0.00 |
|
Vegetables |
992.50 |
44.37 |
4.47 |
|
Total |
2264.70 |
251.62 |
11.11 |
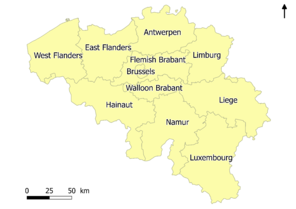
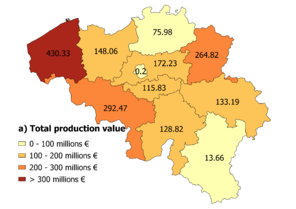
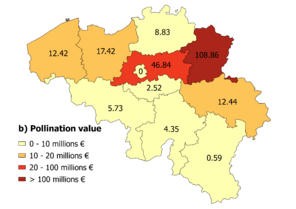
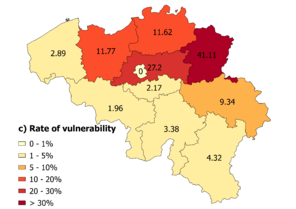
The rate of vulnerability of crops used for human food is about 11.1% at the national scale and ranges from 0.0% (Brussels Capital) to 41.1% (Limburg) at the provincial one. Even if these values of the pollination service depends heavily on our knowledge of pollination requirements which may vary between varieties and area (
It should be noted that products of some large Belgian crops (e.g., cereals, sugar beets) are not entirely used for human consumption (
Estimates of potential production loss would also be more realistic if taking into account the rate of decline of pollinators and their substitutability, but also changes in other factors than only pollinator decline. Currently this caveat cannot be taken into account in the production function proposed by
The hypothesis of total disappearance of the pollinators which is behind these calculations is binding or even unrealistic. Although local extinction is feasible, it is unlikely to occur on a larger scale. Nevertheless, the mapping of these indices highlights the geographical distribution of the preservation issues of pollinators and show the importance of preserving pollinating activity to ensure the sustainability of Belgian agricultural production. In this sense, it could constitute a tool to aid decision to prioritize conservation measures of pollinators on Belgian territory, including the implementation of agri-environmental schemes (e.g., sown wildflower strips, high biological value meadows). They generally enhance species richness and abundance of major pollinator groups but not rare and/or declining species. Thus, they preserve the crop pollination service but their role in the conservation of threatened pollinator species is limited (
Conclusions
Although many of the largest production areas are independent on pollinators (cereals) and are wind-pollinated, a large portion of fruit crops (e.g., apple, pears, cherries) are potentially vulnerable to pollinator decline. Because insect pollination is the most effective natural pollination method, if it becomes insufficient, it can be replaced only by an action of man to maintain yields (
To better assess pollination service, more information is needed to understand how the dependency of crop production on pollinators varies, including in relation to crop variety, production area, and pollinator diversity and abundance (
Despite its imperfections, this method used here has the advantage of being simple (to use and compare), robust, easily transposable to different scales and low cost. It shows the necessity to define policy recommendations in favor of the protection of pollinator insects (e.g., planting wild melliferous plant species) due to the high value of pollination service, particularly in the case of fruit crops. Yet, this value relates only to one aspect of the pollination service and therefore gives only a minimal value of it. It does not take into account for example its contribution to crop production not used for human consumption (forage and industrial crops, ornamentals), human health (essential micronutrients), pollinator patrimonial value (education, recreation, inspiration,…) or to wild plant species and landscapes conservation (
References
- The Swiss agri-environment scheme enhances pollinator diversity and plant reproductive success in nearby intensively managed farmland.Journal of Applied Ecology44(4):813‑822. https://doi.org/10.1111/j.1365-2664.2007.01306.x
- Alien parasite hitchhikes to Patagonia on invasive bumblebee.Biological Invasions15(3):489‑494. https://doi.org/10.1007/s10530-012-0311-0
- Farmland biodiversity: is habitat heterogeneity the key?Trends in Ecology & Evolution18(4):182‑188. https://doi.org/10.1016/S0169-5347(03)00011-9
- EFESE - Le service de pollinisation.Commissariat général au développement durable,46pp.
- Parallel Declines in Pollinators and Insect-Pollinated Plants in Britain and the Netherlands.Science313(5785):351‑354. https://doi.org/10.1126/science.1127863
- Neonicotinoids in bees: a review on concentrations, side-effects and risk assessment.Ecotoxicology21(4):973‑992. https://doi.org/10.1007/s10646-012-0863-x
- Weeds for bees? A review.Agronomy for Sustainable Development35(3):891‑909. https://doi.org/10.1007/s13593-015-0302-5
- Patterns of widespread decline in North American bumble bees.Proceedings of the National Academy of Sciences108(2):662‑667. https://doi.org/10.1073/pnas.1014743108
- Species richness declines and biotic homogenisation have slowed down for NW-European pollinators and plants.Ecology Letters16(7):870‑878. https://doi.org/10.1111/ele.12121
- Etat des lieux des flux céréaliers en Wallonie selon différentes filières d'utilisation.Biotechnologie, Agronomie, Société et Environnement18(2):181‑192.
- Guidelines for the economic valuation of pollination services at a national scale.FAO,Rome.
- Economic valuation of the vulnerability of world agriculture confronted with pollinator decline.Ecological Economics68(3):810‑821. https://doi.org/10.1016/j.ecolecon.2008.06.014
- Wild Pollinators Enhance Fruit Set of Crops Regardless of Honey Bee Abundance.Science339(6127):1608‑1611. https://doi.org/10.1126/science.1230200
- Pollinator shortage and global crop yield.Communicative & Integrative Biology2(1):37‑39. https://doi.org/10.4161/cib.2.1.7425
- Bee declines driven by combined stress from parasites, pesticides, and lack of flowers.Science347(6229):1255957‑1255957. https://doi.org/10.1126/science.1255957
- Sown wildflower strips for insect conservation: a review.Insect Conservation and Diversity4(1):60‑80. https://doi.org/10.1111/j.1752-4598.2010.00098.x
- Functional group diversity of bee pollinators increases crop yield.Proceedings of the Royal Society of London B: Biological Sciences275(1648):2283‑2291. https://doi.org/10.1098/rspb.2008.0405
- The assessment report of the Intergovernmental Science-Policy Platform on Biodiversity and Ecosystem Services on pollinators, pollination and food production.Secretariat of the Intergovernmental Science-Policy Platform on Biodiversity and Ecosystem Services,Bonn, Germany,552pp.
- Resource diversity and landscape-level homogeneity drive native bee foraging.Proceedings of the National Academy of Sciences110(2):555‑558. https://doi.org/10.1073/pnas.1208682110
- A Retrospective Analysis of Pollen Host Plant Use by Stable and Declining Bumble Bee Species.Ecology89(7):1811‑1823. https://doi.org/10.1890/07-1275.1
- Importance of pollinators in changing landscapes for world crops.Proceedings of the Royal Society B: Biological Sciences274(1608):303‑313. https://doi.org/10.1098/rspb.2006.3721
- The decline of the bumble bees and cuckoo bees (Hymenoptera: Apidae: Bombini) of Western and Central Europe.Oryx41(01):79‑88. https://doi.org/10.1017/S0030605307001597
- Kremen C, Chaplin-Kramer R (2007) Insects as providers of ecosystem services: crop pollination and pest control. In: Stewart AJA, New TR, Lewis OT (Eds) Insect Conservation Biology: Proceedings of the Royal Entomological Society's 23nd Symposium. [ISBN978-1-84593-254-1].
- Analyse des 1600 premieres cartes de l' atlas provisoire des insectes de Belgique, et premiere liste rouge d' insectes menaces dans la faune belge.Notes Fauniques de Gembloux (Belgium)4:1‑104.
- Modelling pollination services across agricultural landscapes.Annals of Botany103:1589‑1600. https://doi.org/10.1093/aob/mcp069
- Microsatellite analysis in museum samples reveals inbreeding before the regression of Bombus veteranus.Apidologie44(2):188‑197. https://doi.org/10.1007/s13592-012-0170-9
- How many flowering plants are pollinated by animals?Oikos120(3):321‑326. https://doi.org/10.1111/j.1600-0706.2010.18644.x
- Global pollinator declines: trends, impacts and drivers.Trends in Ecology & Evolution25(6):345‑353. https://doi.org/10.1016/j.tree.2010.01.007
- Safeguarding pollinators and their values to human well-being.Nature540(7632):220‑229. https://doi.org/10.1038/nature20588
- First estimation of faunistic drift by bumblebees of Belgium, (Hymenoptera: Apidae). - Première estimation de la dérive faunique chez les bourdons de la Belgique (Hymenoptera : Apidae).Annales de la Societe Royale Zoologique de Belgique118:141‑147.
- Climatic Risk and Distribution Atlas of European Bumblebees.BioRisk10:1‑236. https://doi.org/10.3897/biorisk.10.4749
- Landscape effects on crop pollination services: are there general patterns?Ecology Letters11(5):499‑515. https://doi.org/10.1111/j.1461-0248.2008.01157.x
- Environmental factors driving the effectiveness of European agri-environmental measures in mitigating pollinator loss – a meta-analysis.Ecology Letters16(7):912‑920. https://doi.org/10.1111/ele.12128
- The impact of over 80 years of land cover changes on bee and wasp pollinator communities in England.Proceedings of the Royal Society B: Biological Sciences282(1806):20150294‑20150294. https://doi.org/10.1098/rspb.2015.0294
- Steffan-Dewenter I, Klein AM, Gaebele V, Alfert T, Tscharntke T (2006) Bee diversity and plant-pollinator interactions in fragmented landscapes. In: Nickolas NM, Ollerton J (Eds) Plant-pollination interactions; from specialization to generalization. [ISBN0-226-87400-1].
- Are ecosystem services stabilized by differences among species? A test using crop pollination.Proceedings of the Royal Society of London B: Biological Sciences276(1655):229‑237. https://doi.org/10.1098/rspb.2008.0709
- Valuing pollination services to agriculture.Ecological Economics71:80‑88. https://doi.org/10.1016/j.ecolecon.2011.08.001
- A meta-analysis of bees' responses to anthropogenic disturbance.Ecology90(8):2068‑2076. https://doi.org/10.1890/08-1245.1