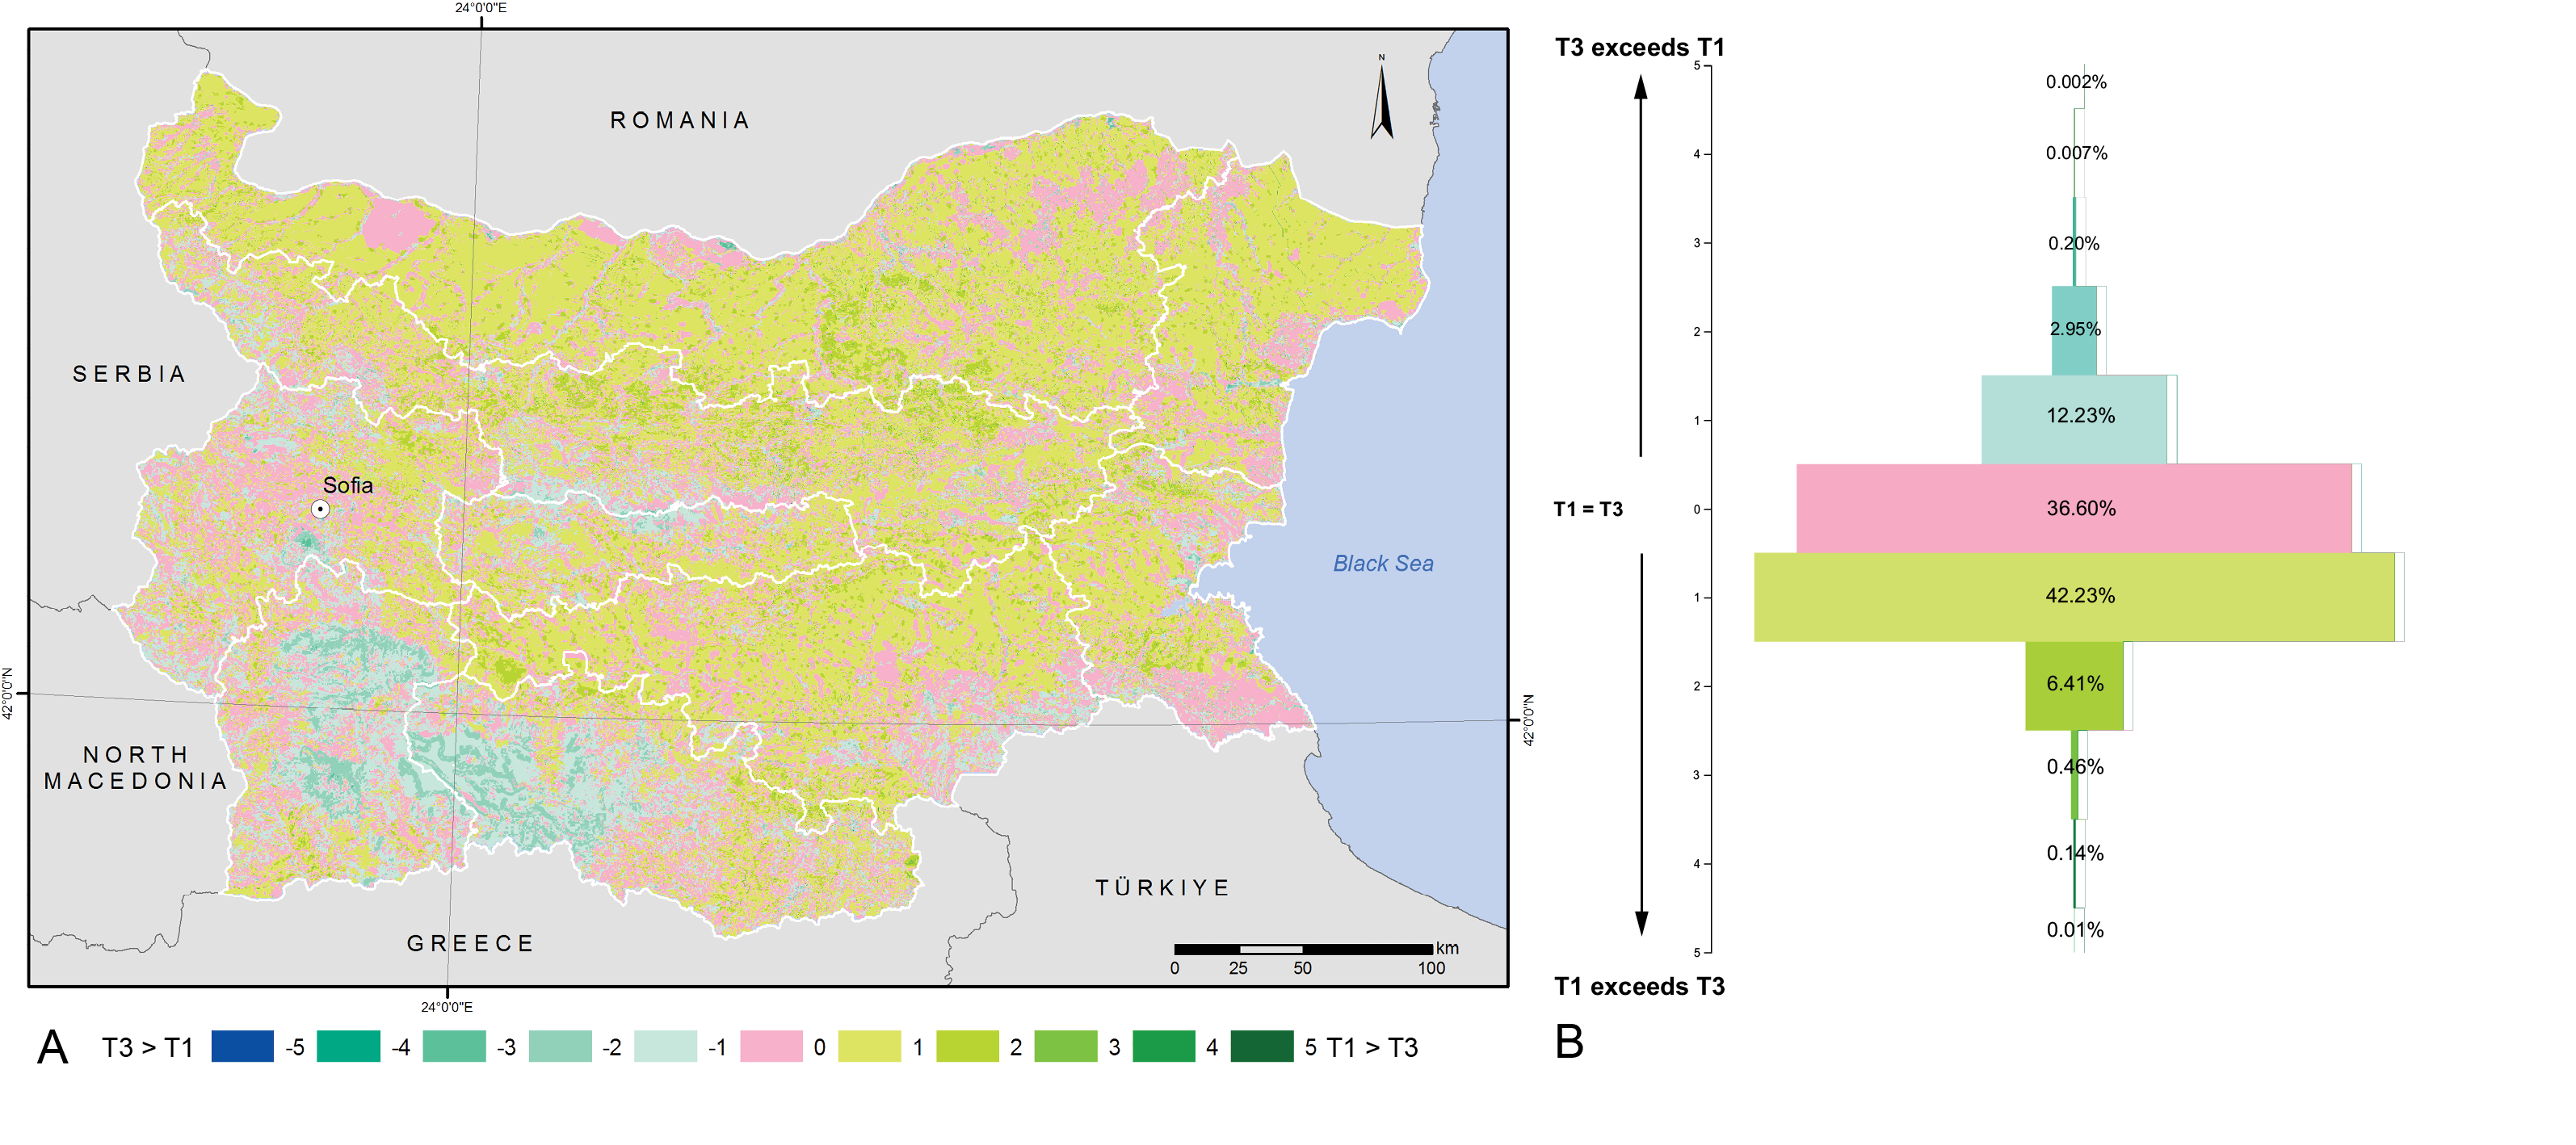
Comparison between tier 1 and tier 3. A - Spatial distribution of a negative image between both layers where T3 exceed T1 and vice versa, B - % of the whole area.
|
|
||
|
Comparison between tier 1 and tier 3. A - Spatial distribution of a negative image between both layers where T3 exceed T1 and vice versa, B - % of the whole area. |
||
| Part of: Nedkov S, Nikolova M, Prodanova H, Stoycheva V, Hristova D, Sarafova E (2022) A multi-tiered approach to map and assess the natural heritage potential to provide ecosystem services at a national level. One Ecosystem 7: e91580. https://doi.org/10.3897/oneeco.7.e91580 |