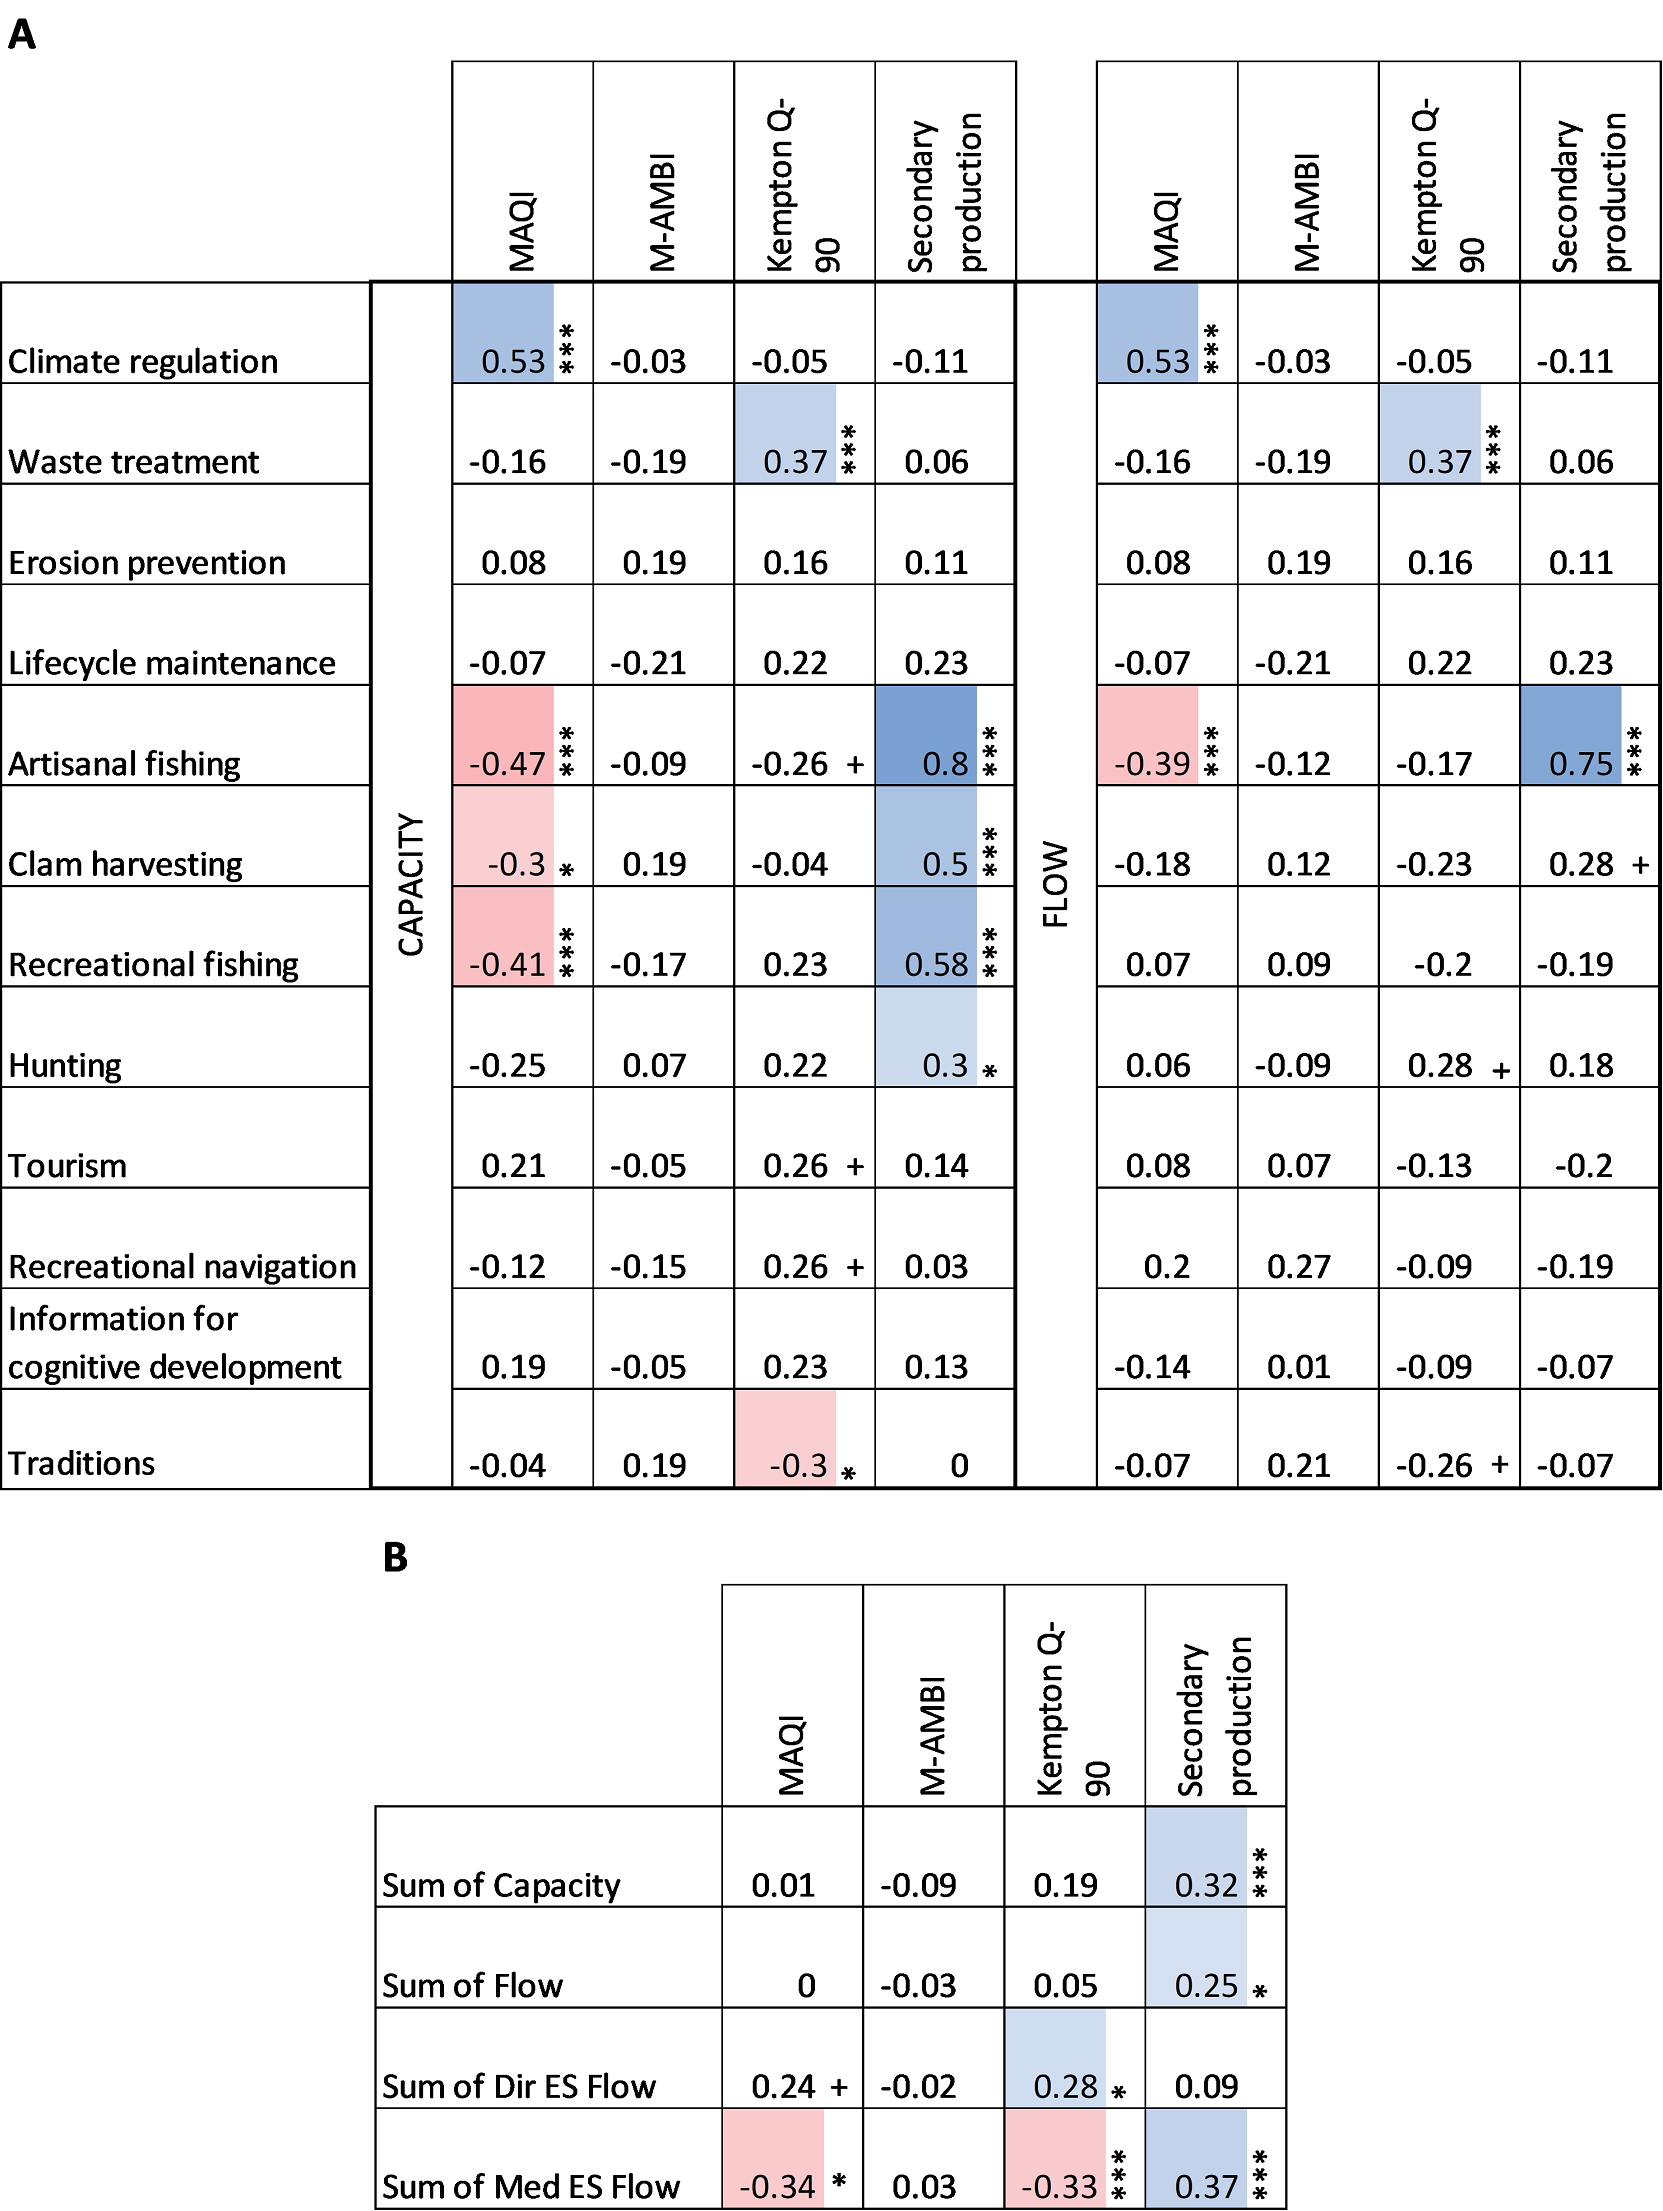
Spearman’s correlation between ecological status indicators (MAQI, M-AMBI, Kempton Q-90 and Secondary Production) and ES (A: capacity and flow of single ES, B: ES aggregated indicators), computed without using the water bodies as spatial units. Symbols near the correlation coefficient represent the significance level (+: p-value < 0.1; *: p-value < 0.05; **: p-value < 0.01; ***: p-value < 0.001), adjusted for multiple comparisons using Holm's correction. Significant correlation coefficients (p-value < 0.05) are coloured in blue or red (representing positive and negative correlations, respectively).