Boxplots for the indicators representing the provision capacity (PCmo: based on modelled actual soil loss data, PCme: based on measured actual soil loss data), grouped by regions [-] (n = 29181, number of raster cells).
|
|
||
|
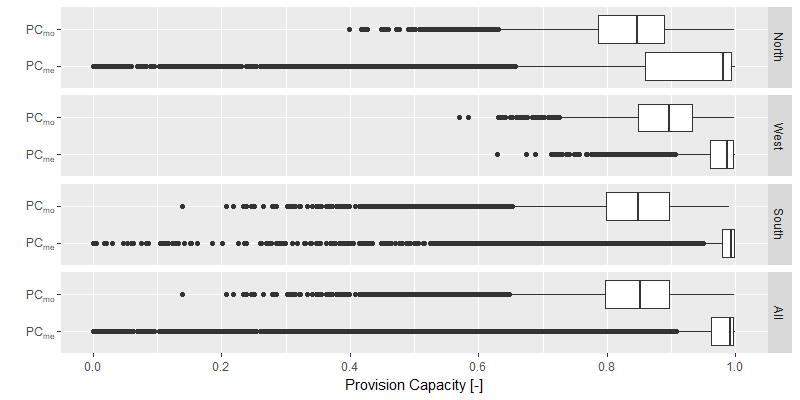
Boxplots for the indicators representing the provision capacity (PCmo: based on modelled actual soil loss data, PCme: based on measured actual soil loss data), grouped by regions [-] (n = 29181, number of raster cells). |
||
| Part of: Steinhoff-Knopp B, Burkhard B (2018) Mapping Control of Erosion Rates: Comparing Model and Monitoring Data for Croplands in Northern Germany. One Ecosystem 3: e26382. https://doi.org/10.3897/oneeco.3.e26382 |