Flow chart of the model for mapping and assessment of the cooling capacity and cooling effect of urban green infrastructure, building on
|
|
||
|
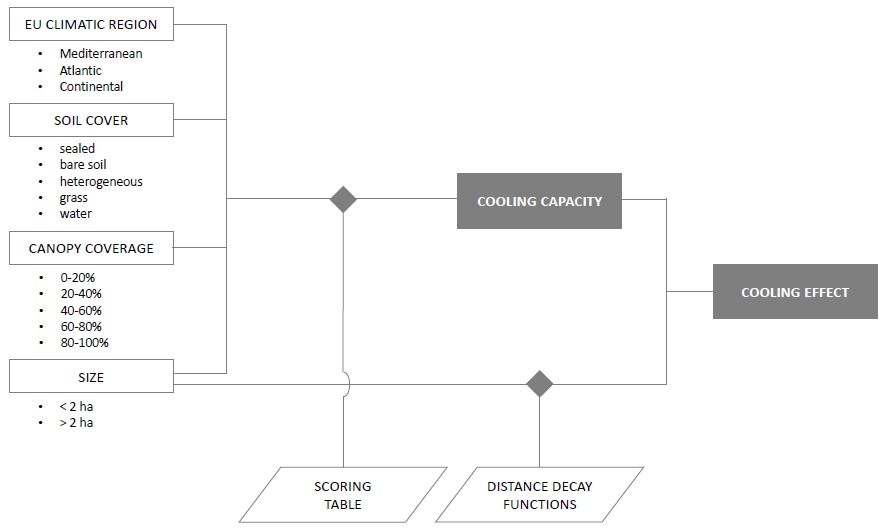
Flow chart of the model for mapping and assessment of the cooling capacity and cooling effect of urban green infrastructure, building on |
||
| Part of: Cortinovis C, Geneletti D (2018) Mapping and assessing ecosystem services to support urban planning: A case study on brownfield regeneration in Trento, Italy. One Ecosystem 3: e25477. https://doi.org/10.3897/oneeco.3.e25477 |