Correlograms for each dataset (a: SH_M; b: SH_LG; c: B_LG_B2; d: B_LG_B4; e: B_FG_B4; for explanation see Table
|
|
||
|
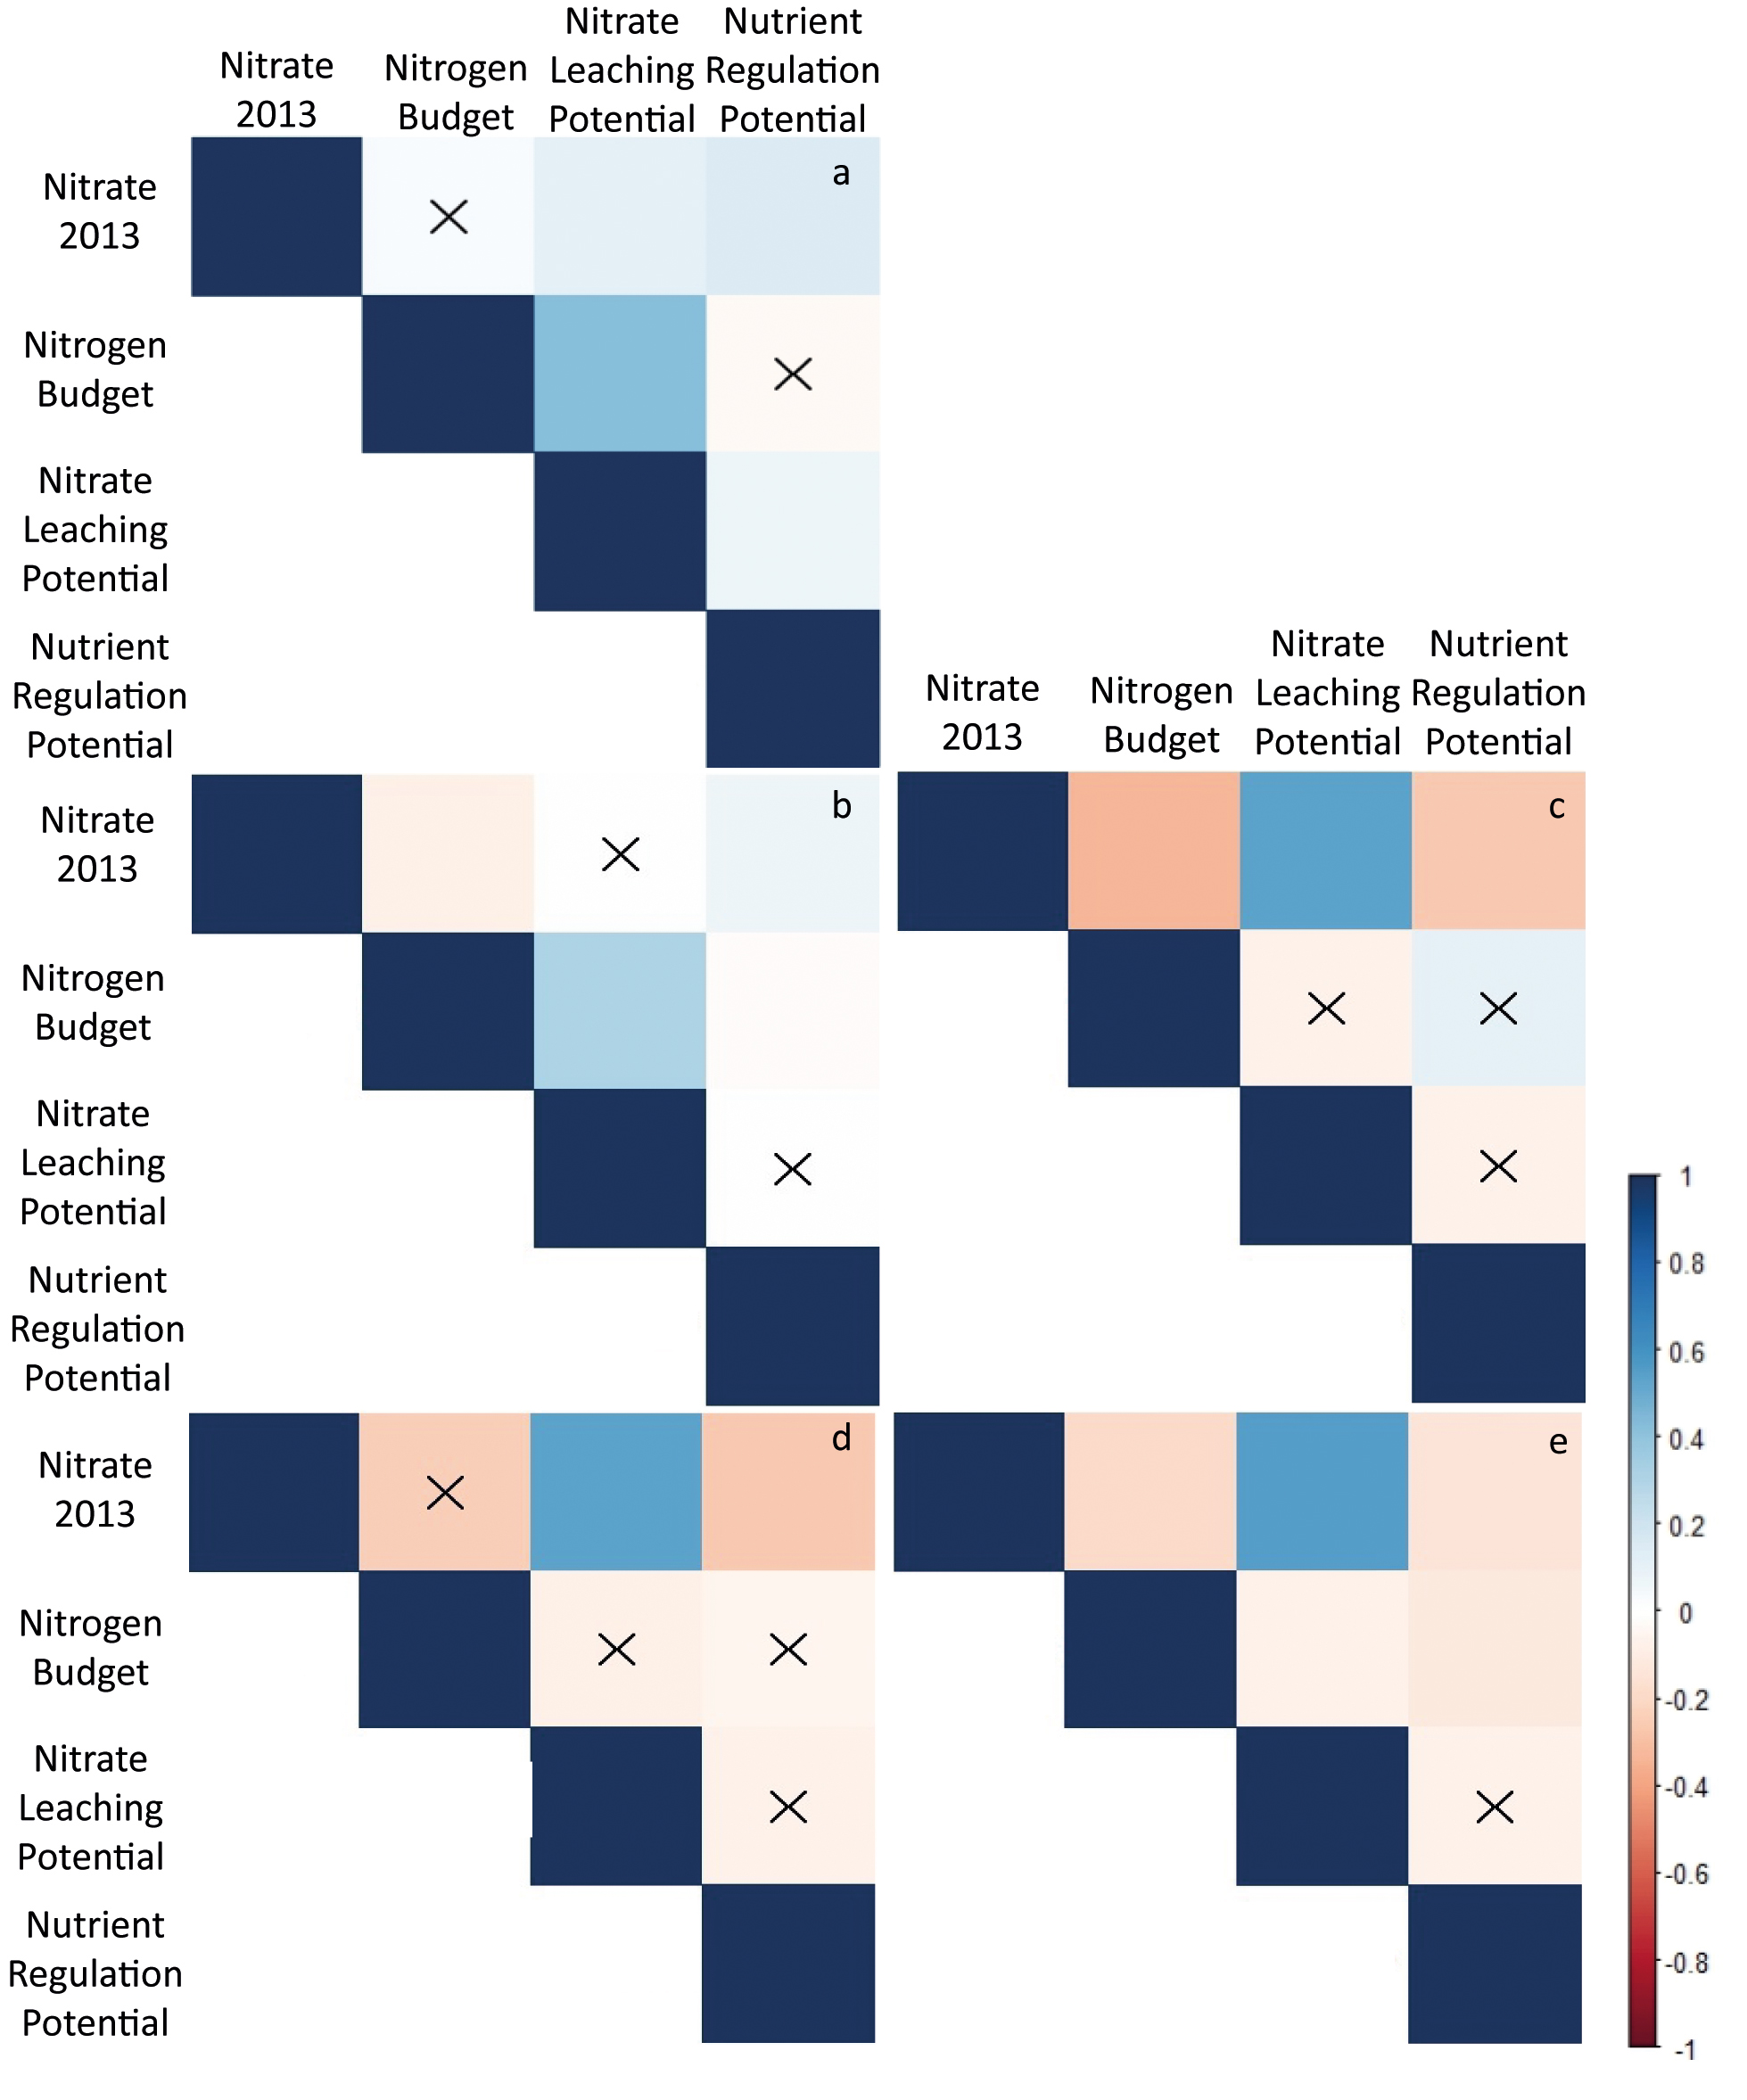
Correlograms for each dataset (a: SH_M; b: SH_LG; c: B_LG_B2; d: B_LG_B4; e: B_FG_B4; for explanation see Table |
||
| Part of: Bicking S, Burkhard B, Kruse M, Müller F (2018) Mapping of nutrient regulating ecosystem service supply and demand on different scales in Schleswig-Holstein, Germany. One Ecosystem 3: e22509. https://doi.org/10.3897/oneeco.3.e22509 |