|
One Ecosystem :
Research Article
|
|
Corresponding author:
Academic editor: Pavel Stoev
Received: 09 Jun 2016 | Accepted: 13 Jun 2016 | Published: 14 Jun 2016
© 2016 Bianca Lopez, Kevin Burgio, Marcos Carlucci, Kyle Palmquist, Andres Parada, Vanessa Weinberger, Allen Hurlbert
This is an open access article distributed under the terms of the Creative Commons Attribution License (CC BY 4.0), which permits unrestricted use, distribution, and reproduction in any medium, provided the original author and source are credited.
Citation:
Lopez B, Burgio K, Carlucci M, Palmquist K, Parada A, Weinberger V, Hurlbert A (2016) A new framework for inferring community assembly processes using phylogenetic information, relevant traits and environmental gradients. One Ecosystem 1: e9501. https://doi.org/10.3897/oneeco.1.e9501
|
|
Abstract
Background
Functional and phylogenetic diversity are increasingly used to infer the important community assembly processes that have structured local communities, which is one of the most fundamental issues in ecology. However, there are critical assumptions and pitfalls associated with these analyses, which can create ambiguity in interpreting results.
New information
Here, we present a conceptual framework which integrates three approaches to reduce the likelihood of drawing incorrect conclusions from analyses of functional and phylogenetic diversity (FD and PD, respectively):
- testing hypotheses for how diversity measures and ecological processes vary along an environmental gradient;
- analysis of both FD and PD in concert; and
- careful selection of traits related to processes of interest for inclusion in FD analyses.
We describe the utility of each of these recommendations and show, using hypothetical examples, how combining these approaches can strengthen one’s ability to correctly infer community assembly. We present this framework in the context of identifying the signatures of interspecific competition and environmental filtering, important processes that operate in many systems across different taxa and are most often referred to in the FD and PD literature. We provide examples showing how our framework can be used to test general hypotheses such as the Stress-Dominance Hypothesis, which predicts a shift in the relative importance of environmental filtering and competition along a gradient of environmental stress, using PD and FD calculated separately for alpha (competition-related) traits and beta (environmental filtering-related) traits. Our approach can be applied to other processes besides competition and environmental filtering. This framework has the potential to enhance comparability between studies, allow for testing of alternative hypotheses regarding changes in community assembly processes along gradients, and improve interpretations of FD and PD analyses.
Keywords
ecology, environmental filtering, phylogenetics, environmental gradients, functional biodiversity, phylogenetic biodiversity, community assembly
Introduction
A long-standing goal in ecology has been to document patterns in natural community structure and connect these patterns to underlying processes such as environmental filtering, disturbance, competition, and predation (i.e. community assembly processes). Over the last decade, ecologists have increasingly attempted to infer community assembly processes from observed species composition by calculating communities’ functional and phylogenetic diversity (hereafter “FD” and “PD”, respectively), measures that describe the distributions of functional traits or the degree of phylogenetic relatedness among co-occurring species (
The approach of inferring processes from these measures is based on the idea that deterministic community assembly processes produce consistent patterns in trait distributions or the phylogenetic relationships within communities, by creating communities of species that are either more similar or dissimilar than expected by chance (
Recently, several authors have cautioned that care must be taken when using FD and PD, since inappropriate choice of traits, diversity metrics, or null models can produce ambiguous results and even lead to incorrect conclusions about the processes underlying community assembly (e.g.
First, FD and PD have often been treated as interchangeable, based on the assumption that functional traits (and, more generally, ecologically important aspects of the niche) are phylogenetically conserved, so that closely related species share similar traits (
While there are indeed cases in which these assumptions are supported, there are also many cases where they are not: many ecologically important traits do not show strong phylogenetic signal (
The growing recognition that the common assumptions of FD and PD studies are not always valid has not diminished the prevalence of these studies (as evidenced by a number of published studies in 2016, e.g.
Here, we review three of these approaches and describe their utility: 1) consideration of how diversity measures and ecological processes vary along an environmental gradient; 2) analysis of both FD and PD, and explicit testing for phylogenetic signal of traits; and 3) careful selection of traits related to processes of interest for inclusion in FD analyses. We then go a step further by presenting a framework that integrates all three, and use hypothetical examples to show how combining these approaches can strengthen one’s ability to correctly infer community assembly processes. We consider three major benefits of this framework over the ways that FD and PD analyses have typically been done: it requires that authors explicitly recognize the assumptions that go into choosing traits and predicting the responses of FD and PD to community assembly processes; it involves comparison of multiple lines of evidence to draw conclusions, allowing for tests of multiple alternative hypotheses for how community structure responds to community assembly processes; and it can be applied to multiple taxa and ecosystems, thus promoting comparison across studies.
Here we focus on using this framework to detect the effects of competition and environmental filtering, two community assembly processes that are most commonly discussed in the literature. Substantial work has been done to identify the functional traits most relevant to these processes for a variety of systems (e.g.
Testing hypotheses that predict changes in diversity metrics along environmental gradients
One way to improve confidence in interpreting community assembly processes from FD and/or PD is to examine changes in these measures along an environmental gradient (e.g.
What are often lacking in studies that use PD and FD to detect community assembly processes are forthright hypotheses for how community assembly processes, and thus FD and/or PD patterns, are expected to change along the focal environmental gradient. Instead, these studies tend to rely on post hoc interpretations of patterns based on the assumption that competition causes over-dispersion and environmental filtering creates clustering. Hypothesis testing would create more transparent, and therefore more robust and comparable, interpretations of results. Considering changes in FD and/or PD along environmental gradients lends itself to hypothesis testing, because there are a number of general ecological hypotheses that predict changes of the relative importance of community assembly processes along resource, disturbance, and/or stress gradients. One example is the Stress-Dominance Hypothesis ("SDH";
Although rarely explicitly referenced, the SDH has been posed in many studies that use FD and PD to infer community assembly processes (e.g.
Incorporating both trait- and phylogenetic information to gain greater insight
PD and FD are often used essentially interchangeably, because when the traits used to calculate FD are highly phylogenetically conserved (i.e. closely related species share similar traits), PD and FD analyses will theoretically produce similar results (
Furthermore, each of these measures has its own benefits and drawbacks (reviewed in
PD, on the other hand, has the advantage of integrating over multiple niche dimensions and may therefore capture subtle differences among niches better than a small set of traits can (
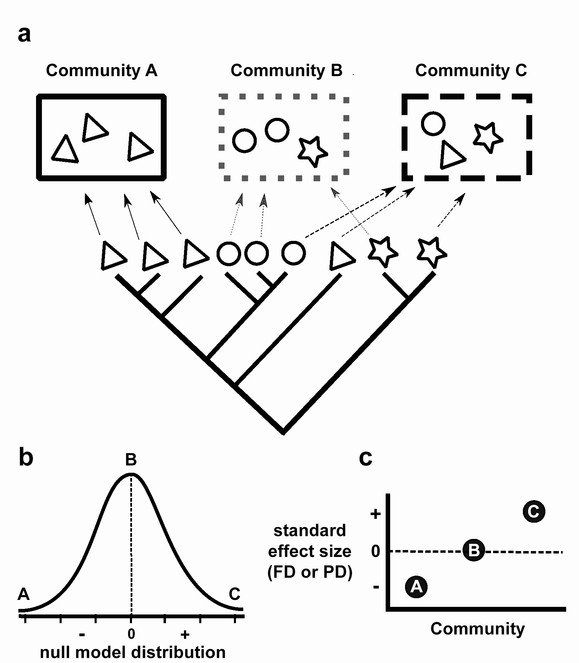
Predicted effects of interspecific competition and environmental filtering on FD and PD.
In Figure 1A, individual species are represented by symbols at the tips of the phylogenetic tree, the shapes of the symbols indicate different trait states, and rectangles represent communities. In this example, the trait is conserved on the phylogeny, such that closely related species tend to have the same traits (shapes). Figure 1B shows the observed PD or FD for each community compared to the distribution of values predicted by the null model; this predicted value is then converted into a standard effect size (SES) relating to the mean of the null model distribution (Figure 1C). Environmental filtering selects for species with similar traits (Community A in Figure 1A), causing functional or phylogenetic clustering (point A in Figure 1C), while interspecific competition limits similarity between co-occurring species resulting in different trait states (Community C in Figure 1A) and functional or phylogenetic overdispersion (point C in Figure 1C). PD or FD that is no different from random expectation can also occur (Community B in Figure 1A, point B in Figure 1C).
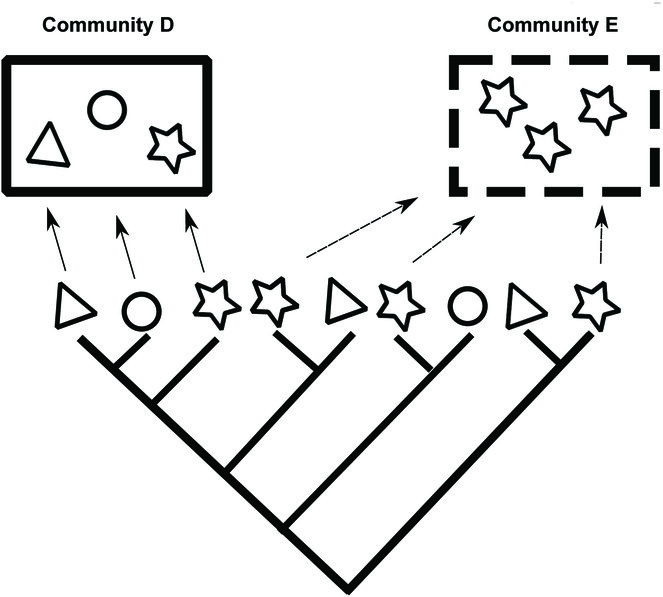
An example highlighting the different interpretations of FD and PD patterns when traits are labile.
When traits used to calculate FD are not phylogenetically conserved, PD values will not necessarily reflect FD. In this example, the trait represented by shape is labile across the phylogeny. As a result, a community that is clustered in PD (Community D) is overdispersed in FD. Similarly, a community that is overdispersed in PD (Community E) could be clustered in FD.
When analyzed together, FD and PD can improve insight into underlying community assembly processes (
Choosing specific traits that relate to individual community assembly processes
The clearest way to connect community assembly processes to FD patterns is to calculate FD from traits with clear linkages to specific processes or particular aspects of a species' niche. For example, some traits provide stress tolerance (e.g. leaf size in plants;
Examples of alpha (competition) and beta (environmental filtering) traits from the literature.
|
Trait |
Role or function |
Taxon |
References |
|
Alpha traits |
|||
|
Height |
Competitive ability |
Plants |
|
|
Lateral spread |
Competitive ability |
Plants |
|
|
Rooting depth |
Resource capture |
Plants |
|
|
Head length, depth |
Feeding strategy |
Fish |
|
|
Gill raker length |
Feeding strategy |
Fish |
|
|
Bite rate |
Foraging behavior |
Fish |
|
|
Bill length |
Feeding strategy |
Birds |
|
|
Foraging stratum |
Feeding strategy |
Birds |
|
|
Trophic position |
Feeding strategy |
Aquatic insects |
|
|
Organic carbon consumption |
Resource capture |
Bacteria |
|
|
Nitrogen fixation |
Resource capture |
Bacteria |
|
|
Beta traits |
|||
|
Leaf size |
Stress tolerance |
Plants |
|
|
Wood density |
Drought tolerance |
Plants |
|
|
Pectoral and pelvic fin length |
Habitat use and locomotion |
Fish |
|
|
Eye size |
Depth habitat |
Fish |
|
|
Wing chord |
Temperature constraints |
Birds |
|
| Body coloration | Camouflage and habitat use | Ants |
|
|
Respiration mode |
Oxygen constraints |
Aquatic insects |
|
|
Ability to form resistant structures |
Stress tolerance |
Bacteria |
|
When trying to detect the signals of multiple community assembly processes, we recommend analyzing FD separately for traits that are related to each process (e.g. environmental filtering traits, competition traits, dispersal traits), which can be thought of as defining different axes of a species’ niche. In the case of competition and environmental filtering, these traits are sometimes called “alpha traits” and “beta traits”, respectively, corresponding to the alpha and beta niche (
Separately analyzing FD calculated from alpha traits and beta traits would not only prevent the problem of competition and environmental filtering masking one another when both types of traits are included in a single FD metric; it can also reduce the likelihood of confusing the effects of these two processes when unexpected or ambiguous patterns are generated, such as if competition causes clustering rather than overdispersion of FD (
One plausible reason is that identifying alpha and beta traits a priori can be challenging. Ideally, determining whether a trait mediates species’ interactions with a particular community assembly process would be done using manipulative experiments that test relationships between species’ resource use or environmental tolerances in relation to their traits (
Combining environmental gradients, phylogenetic information and alpha and beta traits: hypothetical examples
We have argued that analyzing changes in community structure along environmental gradients, considering both phylogenetic and trait information, and choosing traits related to specific processes can all improve the inference of assembly processes. We now describe two simple hypothetical scenarios framed in the context of the Stress-Dominance Hypothesis (SDH), to show how combining these three approaches can strengthen inferences and clarify otherwise ambiguous or misleading results.
The SDH predicts that competition will become more important as the environmental filter weakens. Based on the two dominant assumptions, that PD and FD are essentially interchangeable and that competition causes overdispersion while environmental filtering causes clustering, the most common prediction of the SDH is: PD and FD calculated from both alpha and beta traits (“FDboth”) will be clustered at the harsh end of a stress gradient and overdispersed at the benign end of the gradient (Fig.
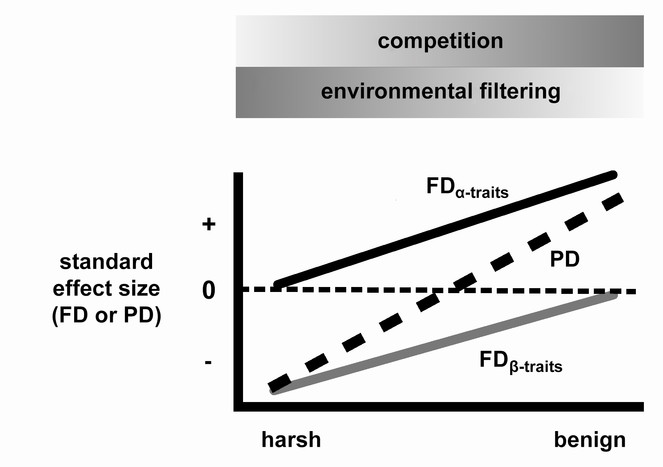
Prediction of the Stress Dominance Hypothesis for FDα-traits, FDβ-traits, and PD.
Horizontal axis represents a gradient of environmental stress. At the harsh end of the gradient, environmental filtering is strongest, so PD is clustered (negative standard effect size). At the benign end of the gradient, competition becomes more important and results in coexistence of functionally and phylogenetically distinct taxa. Thus PD is overdispersed (positive standard effect size). Because it only reflects traits related to competition, FDα-traits would not show clustering at the harsh end of the gradient; similarly, because it only includes traits related to environmental filtering, FDβ-traits would not show overdispersion at the benign end of the gradient.
In the following examples we show that patterns of FDα-traits and FDβ-traits can more clearly distinguish the effects of competition and environmental filtering than either PD or FDboth, and that analyzing PD, FDα-traits, and FDβ-traits in tandem can reveal which community assembly processes are operating. For simplicity, we consider two scenarios: one in which analyzing only PD or FDboth would not show support for the SDH when in fact it is reflected in alpha and beta traits, and one in which the opposite is true and FDα-traits, and FDβ-traits reveal that the SDH is not supported by the data. In all cases, testing for phylogenetic niche conservatism reveals whether FDα-traits and FDβ-traits will provide different information than PD.
Scenario 1: The SDH is supported by FDα-traits and FDβ-traits, but PD shows unexpected pattern
Even when the conditions of the SDH are in place (i.e. there is a shift in relative importance from environmental filtering to competition with decreasing environmental stress), if either alpha or beta traits are not highly phylogenetically conserved, PD could show a number of different patterns along the stress gradient (dashed lines, Fig.
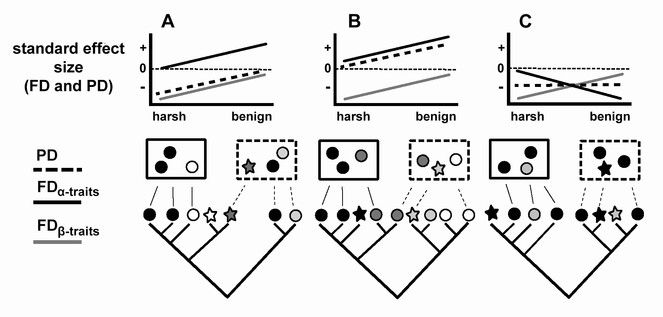
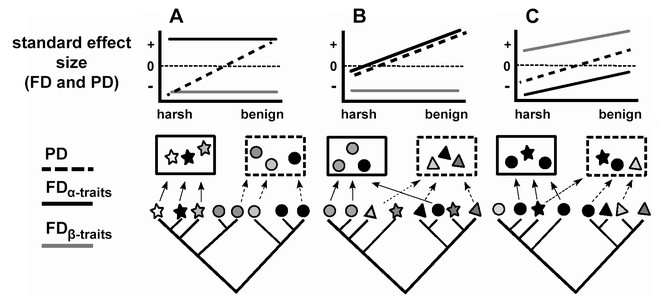
Hypothetical examples of how examining FDα-traits and FDβ-traits shows support for the SDH, even when PD shows an unexpected pattern.
For each example (A-C), individual species are represented by symbols at the tips of the phylogenetic tree; the shape of the symbols represents beta traits, the color of the symbols represents alpha traits, and communities are represented by rectangles. In each example, we show two communities, one at the stressful and one at the benign end of the stress gradient. In case A, the alpha traits are labile while the beta traits are conserved; therefore PD tracks the pattern observed for FDβ-traits, so that competition is not evident from the PD pattern at the benign end of the gradient. In the opposite case (B), alpha traits are conserved but beta traits are not; therefore PD tracks the alpha trait pattern and does not show clustering consistent with environmental filtering at the stressful end of the gradient. In case C, PD shows an unexpected pattern because neither alpha nor beta traits have strong phylogenetic signal and competition shows a different pattern than the one that is generally expected, with strong competition causing competitive exclusion at the benign end of the gradient.
Scenario 1: The SDH is supported by FDα-traits and FDβ-traits, but PD shows unexpected pattern
Even when the conditions of the SDH are in place (i.e. there is a shift in relative importance from environmental filtering to competition with decreasing environmental stress), if either alpha or beta traits are not highly phylogenetically conserved, PD could show a number of different patterns along the stress gradient (dashed lines, Fig.
Separating FD into FDα-traits and FDβ-traits can also clarify patterns when competition causes clustering rather than overdispersion (
Scenario 2: PD shows expected pattern, but the SDH is not supported by FDα-traits and FDβ-traits
The PD pattern predicted by the SDH (Fig.
Hypothetical examples where PD shows the pattern predicted by the SDH, but FDα-traits and FDβ-traits show that the SDH is not supported.
For each example (A-B), individual species are represented by symbols at the tips of the phylogenetic tree; the shape of the symbols represents beta traits, the color of the symbols represents alpha traits, and communities are represented by rectangles. In each example, we show two communities, one at the stressful and one at the benign end of the stress gradient. In case A, both alpha and beta traits are labile on the phylogeny, and looking at these traits would suggest that there is not a shift from environmental filtering to competition along the stress gradient. In case B, the alpha trait is phylogenetically conserved but the beta trait is not, so while the PD pattern appears to support the SDH, the beta trait pattern shows that there is no change in the importance of environmental filtering along the gradient. In case C, the expected PD pattern is generated from strong competition causing competitive exclusion and clustering of FDα-traits at the harsh end of the gradient and environmental heterogeneity and fine-scale environmental filtering causing overdispersion of FDβ-traits at the benign end of the gradient.
This PD pattern could also be created by one of the two processes acting on phylogenetically conserved traits. For example, this could arise if there was a shift from competition to facilitation as the environment becomes more stressful (the Stress Gradient Hypothesis;
Finally, this PD pattern could show the effects of competition and environmental filtering on alpha and beta traits that have phylogenetic signal, but in a way that is not consistent with the SDH. This could occur if competition for resources is actually stronger in harsh environments and causes competitive exclusion of some species (and thus clustered FDα-traits), which could be the case if competition for resources is a stronger force when those resources are limiting (Fig.
Discussion
The conceptual framework we have proposed here has potential to improve the inference of community assembly processes from trait and phylogenetic information by:
- considering changes in diversity measures along an environmental gradient;
- analyzing both PD and FD and explicitly testing for phylogenetic signal of traits; and
- choosing traits for inclusion in FD analyses that directly relate to the processes of interest.
While each of these approaches has been used with some frequency, few studies have used all three (but see
The first benefit is that our framework requires that the researcher explicitly hypothesize how the relative importance of community assembly processes changes along a gradient, make predictions of how FD and PD will change as a result, and choose traits that relate to the processes being examined. As we have described, relating the chosen traits to community assembly processes can aid in distinguishing the effects of those processes. Further, explicit statement of the predictions that are being tested and the assumptions underlying them will help in both interpreting results and weighing confidence in the interpretation.
Second, this framework can produce more robust inferences by comparing multiple lines of evidence to reach conclusions about which community assembly processes have driven community structure. As discussed above, analyzing FD and PD in tandem provides information on both ecological and evolutionary drivers of community structure, and testing for phylogenetic signal in traits can reveal constraints on the relationship between traits and the environment and correlations between different types of traits. Analyzing PD and traits related to each process means that three trends are compared to draw conclusions, reducing the risk of concluding support for a hypothesis that is supported by some, but not all, of the data. Comparing three different trends will also enhance researchers’ ability to test multiple competing hypotheses for how the relative importance of community assembly processes changes along a gradient or how these processes will affect FD and PD patterns, because there is reduced likelihood that two competing hypotheses will produce the same expected patterns for three different diversity metrics.
The third benefit of this framework is that it can be adapted to apply to community assembly processes other than competition and environmental filtering. Although we have focused on environmental filtering and competition, this framework can be implemented more broadly by choosing specific traits (e.g. those that confer fire adaptation or predator resistance) that are related to the processes of interest (e.g. fire, predation) and considering gradients along which their relative importance could be expected to change (e.g. variation in disturbance frequency or predator density). For example, in riparian forests the effect of flooding is often more important in communities close to the riverbank (
One possible limitation of this framework is that it hinges on the ability to identify traits related to individual community assembly processes, which can be difficult because many traits are influenced by a combination of processes (
A promising way forward is to use information garnered from manipulative experiments that elucidate the relationships between individual community assembly processes and specific traits. For example,
Despite some limitations, we believe that our framework provides a useful advance beyond typical analytical approaches that use FD and PD and allows for more robust interpretations of patterns and enhanced potential for synthesis across studies. As with all studies using FD and PD, it is important that appropriate traits, environmental gradients, and null models are used, and that the assumptions involved in inferring community assembly processes from observed community patterns are explicitly recognized. We believe that this framework has the potential to increase confidence in inferences of community assembly processes from analyses of FD and PD, by allowing for comparison of results to predictions based in ecological theory.
Acknowledgements
Funding for this project was provided by a grant from the National Science Foundation to S. Andelman and J. Parrish entitled ‘The Dimensions of Biodiversity Distributed Graduate Seminar’ (1050680). KRB was supported by grant DGE-0753455 and AHH was supported by DEB-1354563 from the National Science Foundation. VPW was funded by the IEB Project ICM- MINECON, P05-002. AP was funded by Proyecto FONDECYT 3150604. MBC was supported by CNPq-Brazil grant 141451/2011-4 and CAPES- Brazil grants BEX-7913/13-3 and 1454013. We would like to thank C. Maranto and J. Parrish for support for this project and M. Willig, P. Wilfahrt, J. Coyle, L. Cisneros, L. Dreiss, P. White, N. Kraft, and two anonymous reviewers for comments that improved this manuscript.
References
- A trait-based approach to community assembly: partitioning of species trait values into within- and among-community components.Ecology Letters10(2):135‑145. https://doi.org/10.1111/j.1461-0248.2006.01006.x
- Niche evolution and adaptive radiation: Testing the order of trait divergence.Ecology87:S50‑S61. https://doi.org/10.1890/0012-9658(2006)87[50:neaart]2.0.co;2
- Resource partitioning along multiple niche axes drives functional diversity in parrotfishes on Caribbean coral reefs.Oecologia179(4):1173‑1185. https://doi.org/10.1007/s00442-015-3406-3
- Trait-based tests of coexistence mechanisms.Ecology Letters16(10):1294‑1306. https://doi.org/10.1111/ele.12157
- Experimental plant communities develop phylogenetically overdispersed abundance distributions during assembly.Ecology94(2):465‑477. https://doi.org/10.1890/11-2279.1
- Ecology’s cruel dilemma, phylogenetic trait evolution and the assembly of Serengeti plant communities.Journal of Ecology99(3):797‑806. https://doi.org/10.1111/j.1365-2745.2011.01795.x
- Relationships among taxonomic, functional, and phylogenetic ant diversity across the biogeographic regions of Europe.Ecography2016:n/a‑n/a. https://doi.org/10.1111/ecog.01938
- Partitioning phylogenetic and functional diversity into alpha and beta components along an environmental gradient in a Mediterranean rangeland.Journal of Vegetation Science24(5):877‑889. https://doi.org/10.1111/jvs.12048
- Positive interactions in communities.Trends in Ecology & Evolution9(5):191‑193. https://doi.org/10.1016/0169-5347(94)90088-4
- Functional and phylogenetic approaches reveal the evolution of diversity in a hyper diverse biota.Ecography38(9):901‑912. https://doi.org/10.1111/ecog.01370
- Microbial community phylogenetic and trait diversity declines with depth in a marine oxygen minimum zone.Ecology93(7):1659‑1673. https://doi.org/10.1890/11-1204.1
- Effects of competition on phylogenetic signal and phenotypic plasticity in plant functional traits.Ecology93:S126‑S137. https://doi.org/10.1890/11-0401.1
- The ecology of differences: assessing community assembly with trait and evolutionary distances.Ecology Letters16(10):1234‑1244. https://doi.org/10.1111/ele.12161
- Using Phylogenetic, Functional and Trait Diversity to Understand Patterns of Plant Community Productivity.PLoS ONE4(5):e5695. https://doi.org/10.1371/journal.pone.0005695
- Individual-based trait analyses reveal assembly patterns in tree sapling communities.Journal of Vegetation Science23(1):176‑186. https://doi.org/10.1111/j.1654-1103.2011.01339.x
- Shocks to the system: community assembly of the oak savanna in a 40-year fire frequency experiment.Ecology93:S52‑S69. https://doi.org/10.1890/11-0502.1
- The merging of community ecology and phylogenetic biology.Ecology Letters12(7):693‑715. https://doi.org/10.1111/j.1461-0248.2009.01314.x
- Phylogenetic Overdispersion in Floridian Oak Communities.The American Naturalist163(6):823‑843. https://doi.org/10.1086/386375
- Mechanisms of Maintenance of Species Diversity.Annual Review of Ecology and Systematics31(1):343‑366. https://doi.org/10.1146/annurev.ecolsys.31.1.343
- Multiple dimensions of bat biodiversity along an extensive tropical elevational gradient.Journal of Animal Ecology83(5):1124‑1136. https://doi.org/10.1111/1365-2656.12201
- Using trait and phylogenetic diversity to evaluate the generality of the stress-dominance hypothesis in eastern North American tree communities.Ecography37(9):814‑826. https://doi.org/10.1111/ecog.00473
- Phylogenetic niche conservatism: what are the underlying evolutionary and ecological causes?New Phytologist196(3):681‑694. https://doi.org/10.1111/j.1469-8137.2012.04298.x
- The quest for trait convergence and divergence in community assembly: are null-models the magic wand?Global Ecology and Biogeography21(3):312‑317. https://doi.org/10.1111/j.1466-8238.2011.00682.x
- Disturbance and resource availability act differently on the same suite of plant traits: revisiting assembly hypotheses.Ecology93(4):825‑835. https://doi.org/10.1890/10-1961.1
- Taxonomic, functional, and phylogenetic dimensions of rodent biodiversity along an extensive tropical elevational gradient.Ecography38(9):876‑888. https://doi.org/10.1111/ecog.00971
- Experimentally testing and assessing the predictive power of species assembly rules for tropical canopy ants.Ecology Letters18(3):254‑262. https://doi.org/10.1111/ele.12403
- Herbivores Promote Habitat Specialization by Trees in Amazonian Forests.Science305(5684):663‑665. https://doi.org/10.1126/science.1098982
- The growth-defense trade-off and habitat specialization by plants in Amazonian forests.Ecology87:150‑62. https://doi.org/10.1890/0012-9658(2006)87[150:tgtahs]2.0.co;2
- Environmental factors predict community functional composition in Amazonian forests.Journal of Ecology102(1):145‑155. https://doi.org/10.1111/1365-2745.12160
- Does pyrogenicity protect burning plants?Ecology91(12):3481‑3486. https://doi.org/10.1890/10-0291.1
- Can environmental constraints determine random patterns of plant species co-occurrence?Ecology and Evolution5(5):1088‑1099. https://doi.org/10.1002/ece3.1349
- Phylogenetic patterns are not proxies of community assembly mechanisms (they are far better).Functional Ecology29(5):600‑614. https://doi.org/10.1111/1365-2435.12425
- Disturbance and stress gradients result in distinct taxonomic, functional and phylogenetic diversity patterns in a subtropical riparian tree community.Journal of Vegetation Science26(5):889‑901. https://doi.org/10.1111/jvs.12288
- Abiotic stress tolerance and competition-related traits underlie phylogenetic clustering in soil bacterial communities.Ecology Letters17(10):1191‑1201. https://doi.org/10.1111/ele.12341
- A phylogenetic approach to disentangling the role of competition and habitat filtering in community assembly of Neotropical forest birds.Journal of Animal Ecology79(6):1181‑1192. https://doi.org/10.1111/j.1365-2656.2010.01725.x
- Untangling the influence of ecological and evolutionary factors on trait variation across hummingbird assemblages.Ecology93:S99‑S111. https://doi.org/10.1890/11-0493.1
- Phylogenetic structure in tropical hummingbird communities.Proceedings of the National Academy of Sciences106:19673‑19678. https://doi.org/10.1073/pnas.0901649106
- Evolution of character displacement in Darwin's finches.Science (New York, N.Y.)313(5784):224‑6. https://doi.org/10.1126/science.1128374
- Trait convergence and trait divergence in herbaceous plant communities: Mechanisms and consequences.Journal of Vegetation Science17(2):255‑260. https://doi.org/10.1111/j.1654-1103.2006.tb02444.x
- Phylogenetic Measures of Biodiversity.The American Naturalist169(3):E68‑E83. https://doi.org/10.1086/511334
- Rethinking Community Assembly through the Lens of Coexistence Theory.Annual Review of Ecology, Evolution, and Systematics43(1):227‑248. https://doi.org/10.1146/annurev-ecolsys-110411-160411
- Trait-based assembly and phylogenetic structure in northeast Pacific rockfish assemblages.Ecology90(9):2444‑2453. https://doi.org/10.1890/08-1841.1
- Plant rarity and the type of clonal growth.Zeitschrift für Ökologie und Naturschutz9:43‑52.
- Phylogenetic diversity, trait diversity and niches: species assembly of ferns along a tropical elevational gradient.Journal of Biogeography38(2):394‑405. https://doi.org/10.1111/j.1365-2699.2010.02433.x
- Light as an environmental filter in fen vegetation.Journal of Vegetation Science15(5):583‑594. https://doi.org/10.1111/j.1654-1103.2004.tb02300.x
- Functional trait and phylogenetic tests of community assembly across spatial scales in an Amazonian forest.Ecological Monographs80:401‑422. https://doi.org/10.1890/09-1672
- Plant functional traits and the multidimensional nature of species coexistence.Proceedings of the National Academy of Sciences112(3):797‑802. https://doi.org/10.1073/pnas.1413650112
- Functional trait differences and the outcome of community assembly: an experimental test with vernal pool annual plants.Oikos123(11):1391‑1399. https://doi.org/10.1111/oik.01311
- Trait Evolution, Community Assembly, and the Phylogenetic Structure of Ecological Communities.The American Naturalist170(2):271‑283. https://doi.org/10.1086/519400
- Predicting changes in community composition and ecosystem functioning from plant traits: revisiting the Holy Grail.Functional Ecology16(5):545‑556. https://doi.org/10.1046/j.1365-2435.2002.00664.x
- Choosing and using multiple traits in functional diversity research.Environmental Conservation42(2):104‑107. https://doi.org/10.1017/s0376892914000307
- Process-Based Species Pools Reveal the Hidden Signature of Biotic Interactions Amid the Influence of Temperature Filtering.The American Naturalist187(1):75‑88. https://doi.org/10.1086/684128
- Phylogenetic niche conservatism, phylogenetic signal and the relationship between phylogenetic relatedness and ecological similarity among species.Ecology Letters11(10):995‑1003. https://doi.org/10.1111/j.1461-0248.2008.01229.x
- Niche lability in the evolution of a Caribbean lizard community.Nature424(6948):542‑545. https://doi.org/10.1038/nature01814
- Simultaneous effects of phylogenetic niche conservatism and competition on avian community structure.Ecology87:S14‑S28. https://doi.org/10.1890/0012-9658(2006)87[14:seopnc]2.0.co;2
- The Limiting Similarity, Convergence, and Divergence of Coexisting Species.The American Naturalist101(921):377‑385. https://doi.org/10.1086/282505
- Elevational gradients in phylogenetic structure of ant communities reveal the interplay of biotic and abiotic constraints on diversity.Ecography34(3):364‑371. https://doi.org/10.1111/j.1600-0587.2010.06629.x
- Does trait conservatism guarantee that indicators of phylogenetic community structure will reveal niche-based assembly processes along stress gradients?Journal of Vegetation Science24(5):820‑833. https://doi.org/10.1111/jvs.12033
- Plant functional traits and community assembly along interacting gradients of productivity and fragmentation.Perspectives in Plant Ecology, Evolution and Systematics15(6):304‑318. https://doi.org/10.1016/j.ppees.2013.08.002
- Opposing effects of competitive exclusion on the phylogenetic structure of communities.Ecology Letters13(9):1085‑1093. https://doi.org/10.1111/j.1461-0248.2010.01509.x
- Rebuilding community ecology from functional traits.Trends in Ecology & Evolution21(4):178‑185. https://doi.org/10.1016/j.tree.2006.02.002
- Beyond taxonomic diversity patterns: how do α, β and γ components of bird functional and phylogenetic diversity respond to environmental gradients across France?Global Ecology and Biogeography20(6):893‑903. https://doi.org/10.1111/j.1466-8238.2010.00647.x
- Seedling survival and seed size: a synthesis of the literature.Journal of Ecology92(3):372‑383. https://doi.org/10.1111/j.0022-0477.2004.00884.x
- Towards understanding resprouting at the global scale.New Phytologist209(3):945‑954. https://doi.org/10.1111/nph.13644
- Measuring biodiversity to explain community assembly: a unified approach.Biological Reviews86(4):792‑812. https://doi.org/10.1111/j.1469-185x.2010.00171.x
- Functional diversity and trait-environment relationships of stream fish assemblages in a large tropical catchment.Freshwater Biology57(5):1060‑1075. https://doi.org/10.1111/j.1365-2427.2012.02768.x
- Functional diversity: back to basics and looking forward.Ecology Letters9(6):741‑758. https://doi.org/10.1111/j.1461-0248.2006.00924.x
- Organization of an Assemblage of Early Successional Species on a Soil Moisture Gradient.Ecology59(6):1248‑1255. https://doi.org/10.2307/1938238
- Phylogenetic Signal, Evolutionary Process, and Rate.Systematic Biology57(4):591‑601. https://doi.org/10.1080/10635150802302427
- Community Diversity: Relative Roles of Local and Regional Processes.Science235(4785):167‑171. https://doi.org/10.1126/science.235.4785.167
- Phylogenies and traits provide distinct insights about the historical and contemporary assembly of aquatic insect communities.Ecology and Evolution6(9):2925‑2937. https://doi.org/10.1002/ece3.2081
- Plant–pollinator interactions and the assembly of plant communities.Trends in Ecology & Evolution23(3):123‑130. https://doi.org/10.1016/j.tree.2007.11.003
- Habitat specialization and the role of trait lability in structuring diverse willow (genusSalix) communities.Ecology93:S138‑S150. https://doi.org/10.1890/11-0406.1
- Phylogeny and the hierarchical organization of plant diversity.Ecology87(7):S39‑S49. https://doi.org/10.1890/0012-9658(2006)87[39:pathoo]2.0.co;2
- Absence of phylogenetic signal in the niche structure of meadow plant communities.Proceedings of the Royal Society B: Biological Sciences273(1582):39‑44. https://doi.org/10.1098/rspb.2005.3288
- Inferring community assembly mechanisms from functional diversity patterns: the importance of multiple assembly processes.Journal of Ecology100(3):652‑661. https://doi.org/10.1111/j.1365-2745.2011.01945.x
- Inferring Ecological Processes from Taxonomic, Phylogenetic and Functional Trait β-Diversity.PLoS ONE6(6):e20906. https://doi.org/10.1371/journal.pone.0020906
- Opposing Patterns of Seasonal Change in Functional and Phylogenetic Diversity of Tadpole Assemblages.PLOS ONE11(3):e0151744. https://doi.org/10.1371/journal.pone.0151744
- The assembly of tropical tree communities - the advances and shortcomings of phylogenetic and functional trait analyses.Ecography36(3):264‑276. https://doi.org/10.1111/j.1600-0587.2012.00121.x
- Ecological and evolutionary determinants of a key plant functional trait: wood density and its community-wide variation across latitude and elevation.American Journal of Botany94(3):451‑459. https://doi.org/10.3732/ajb.94.3.451
- Opposing assembly mechanisms in a Neotropical dry forest: implications for phylogenetic and functional community ecology.Ecology90(8):2161‑2170. https://doi.org/10.1890/08-1025.1
- Let the concept of trait be functional!Oikos116(5):882‑892. https://doi.org/10.1111/j.0030-1299.2007.15559.x
- Phylogenies and Community Ecology.Annual Review of Ecology and Systematics33(1):475‑505. https://doi.org/10.1146/annurev.ecolsys.33.010802.150448
- Assembly rules, null models, and trait dispersion: New questions from old patterns.Oikos74(1):159‑164. https://doi.org/10.2307/3545686
- Plant ecological strategies: some leading dimensions of variation between species.Annual Review of Ecology and Systematics33(1):125‑159. https://doi.org/10.1146/annurev.ecolsys.33.010802.150452
- Communities and Ecosystems.The American Biology Teacher37(9):547‑547. https://doi.org/10.2307/4445419
- Niche conservatism: Integrating evolution, ecology, and conservation biology.Annual Review of Ecology, Evolution, and Systematics36(1):519‑539. https://doi.org/10.1146/annurev.ecolsys.36.102803.095431
- Niche conservatism as an emerging principle in ecology and conservation biology.Ecology Letters13(10):1310‑1324. https://doi.org/10.1111/j.1461-0248.2010.01515.x