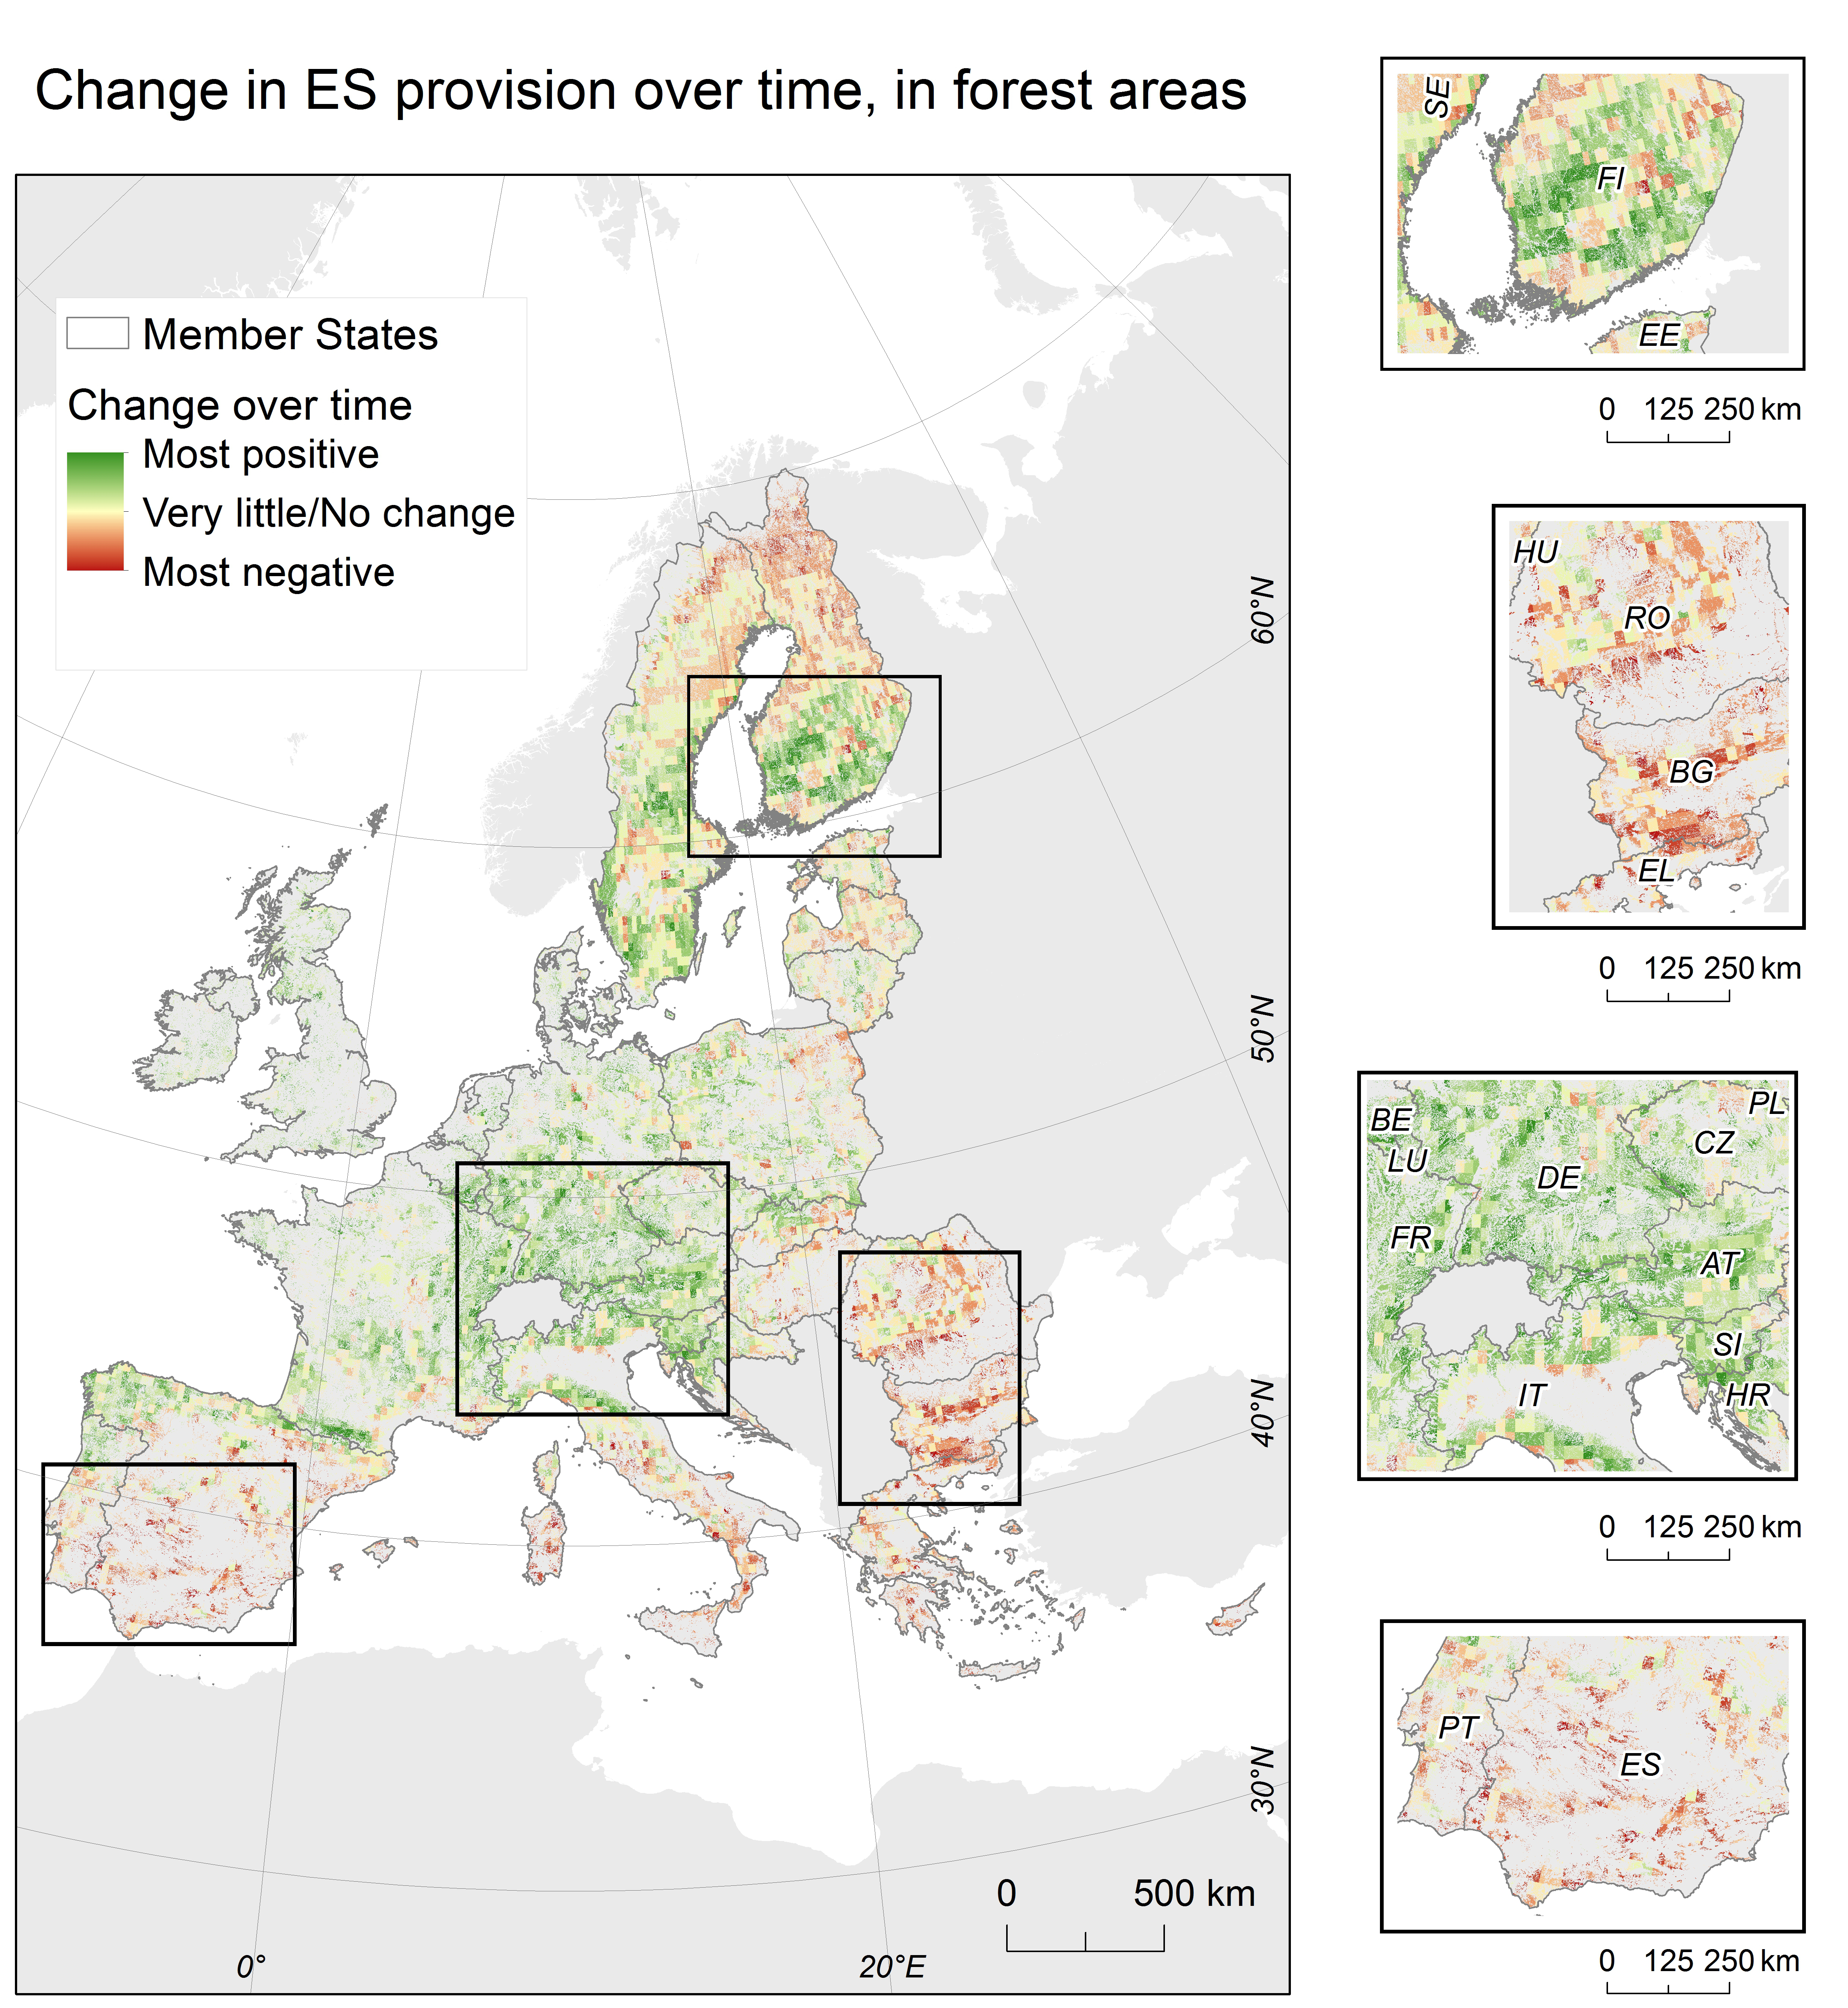
Change in ecosystem service provision over time (2050 vs. baseline) in forest areas over EU-28 (left) and close-up examples (right). Dark shades of green correspond to great positive change, and indicate areas with the greatest increase in ES provision, dark shades of red correspond to great negative change and indicate areas with the greatest decrease in ES provision. Maps are displayed using the Projected Reference System LAEA.