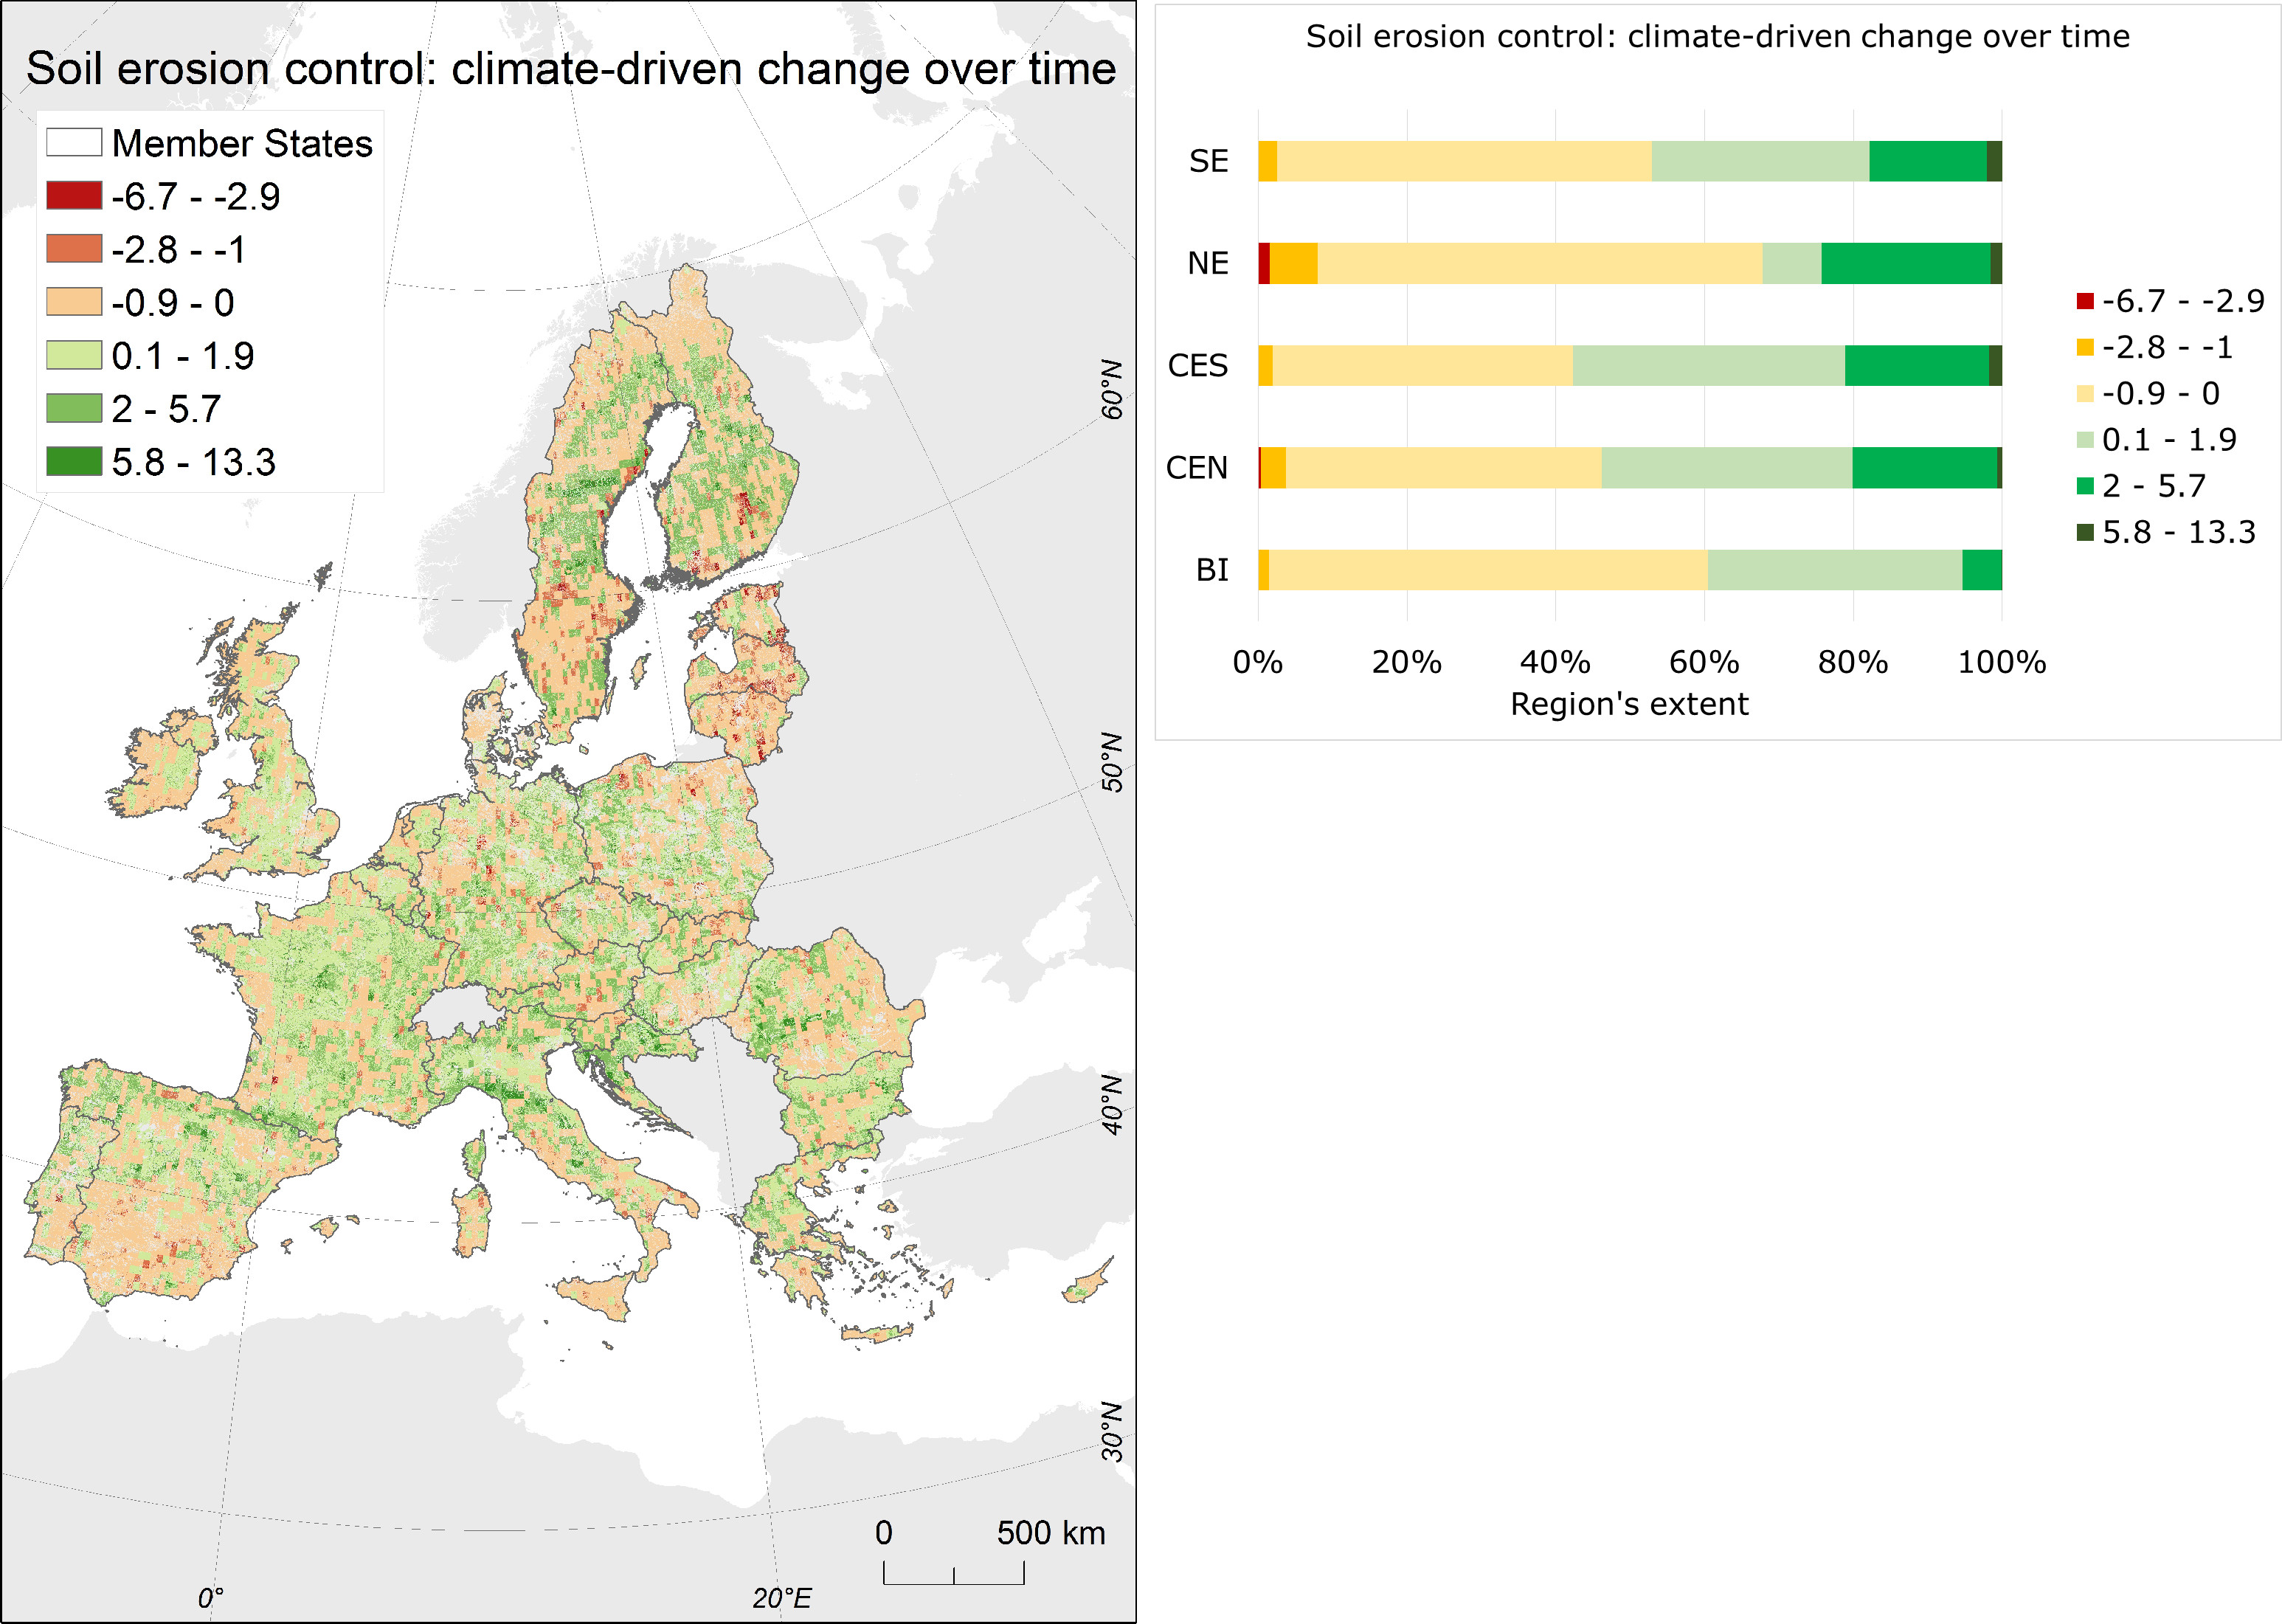
Change in soil erosion control over time (2050 vs. baseline), in areas where LULC was predicted to remain the same. Areas mapped in dark red indicate largest percent decrease, areas mapped in dark green indicate the largest percent increase. The bar chart shows the change as a relative extent percent, for five European regions defined after grouping the 28 Member States according to their climatic characteristics (