| |
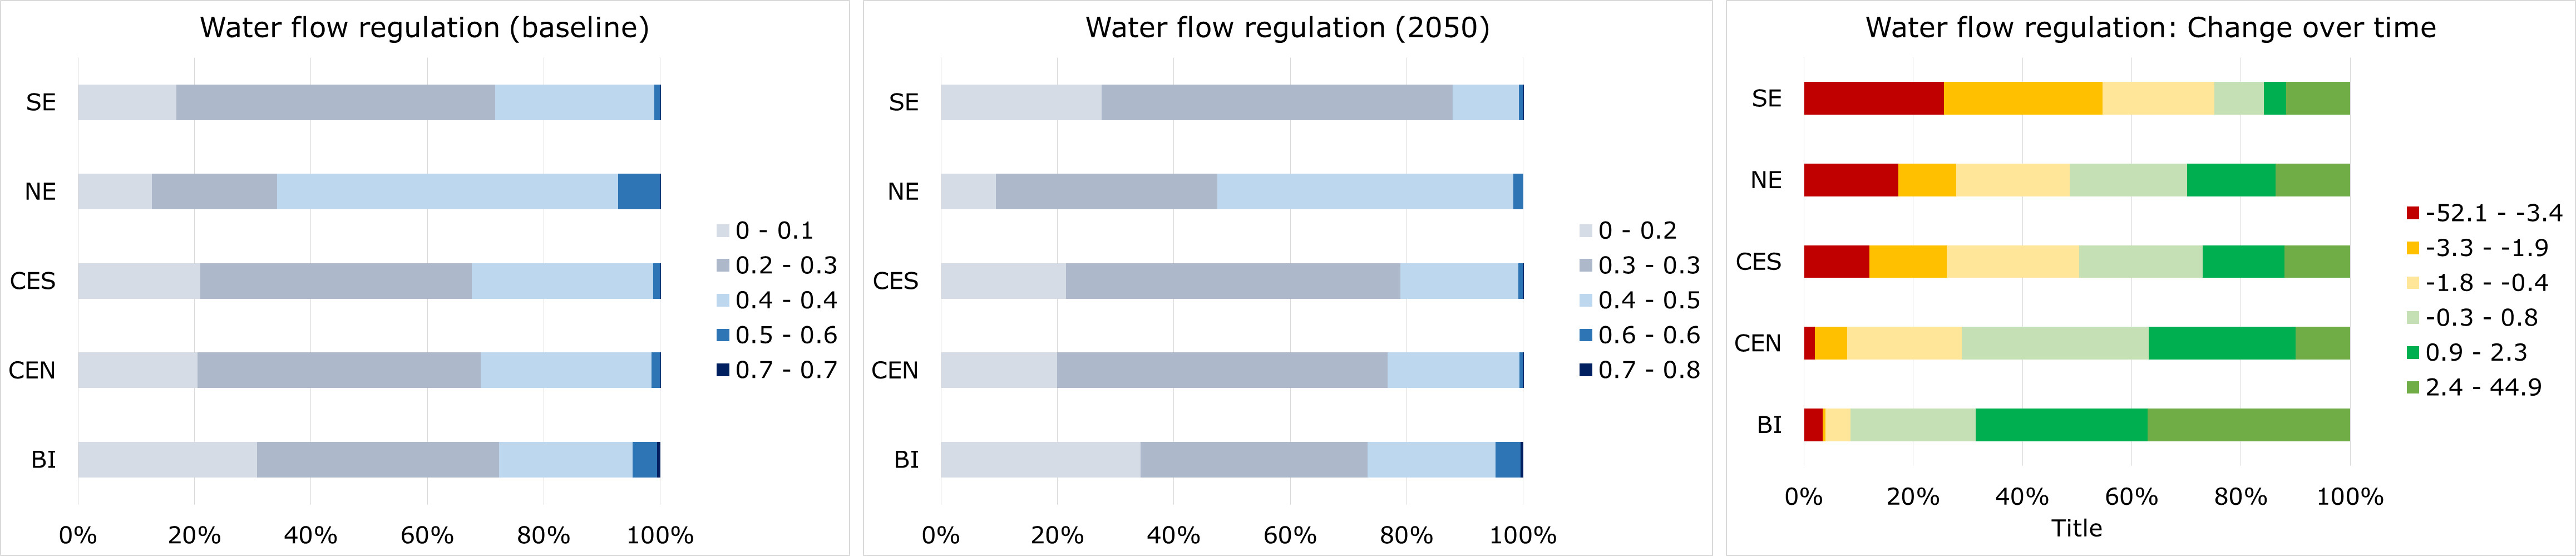
From left to right, water flow regulation for the baseline, the 2050 and as percent change over time. The scores are shown in relation to the percent extent of five European regions, defined after grouping the 28 Member States (MS) according to their climatic characteristics (Ciscar Martinez et al. 2011). The chart on the right shows the percent change over time in the predicted air quality regulation, for the same set of regions. In all charts, the y-axis shows the different regions (SE: South Europe; CEN: Central Europe North; CES: Central Europe South; NE: North Europe; BI: British Isles). See Suppl. material 3 for a grouping of MS within each region. See main text for additional details.
|
|