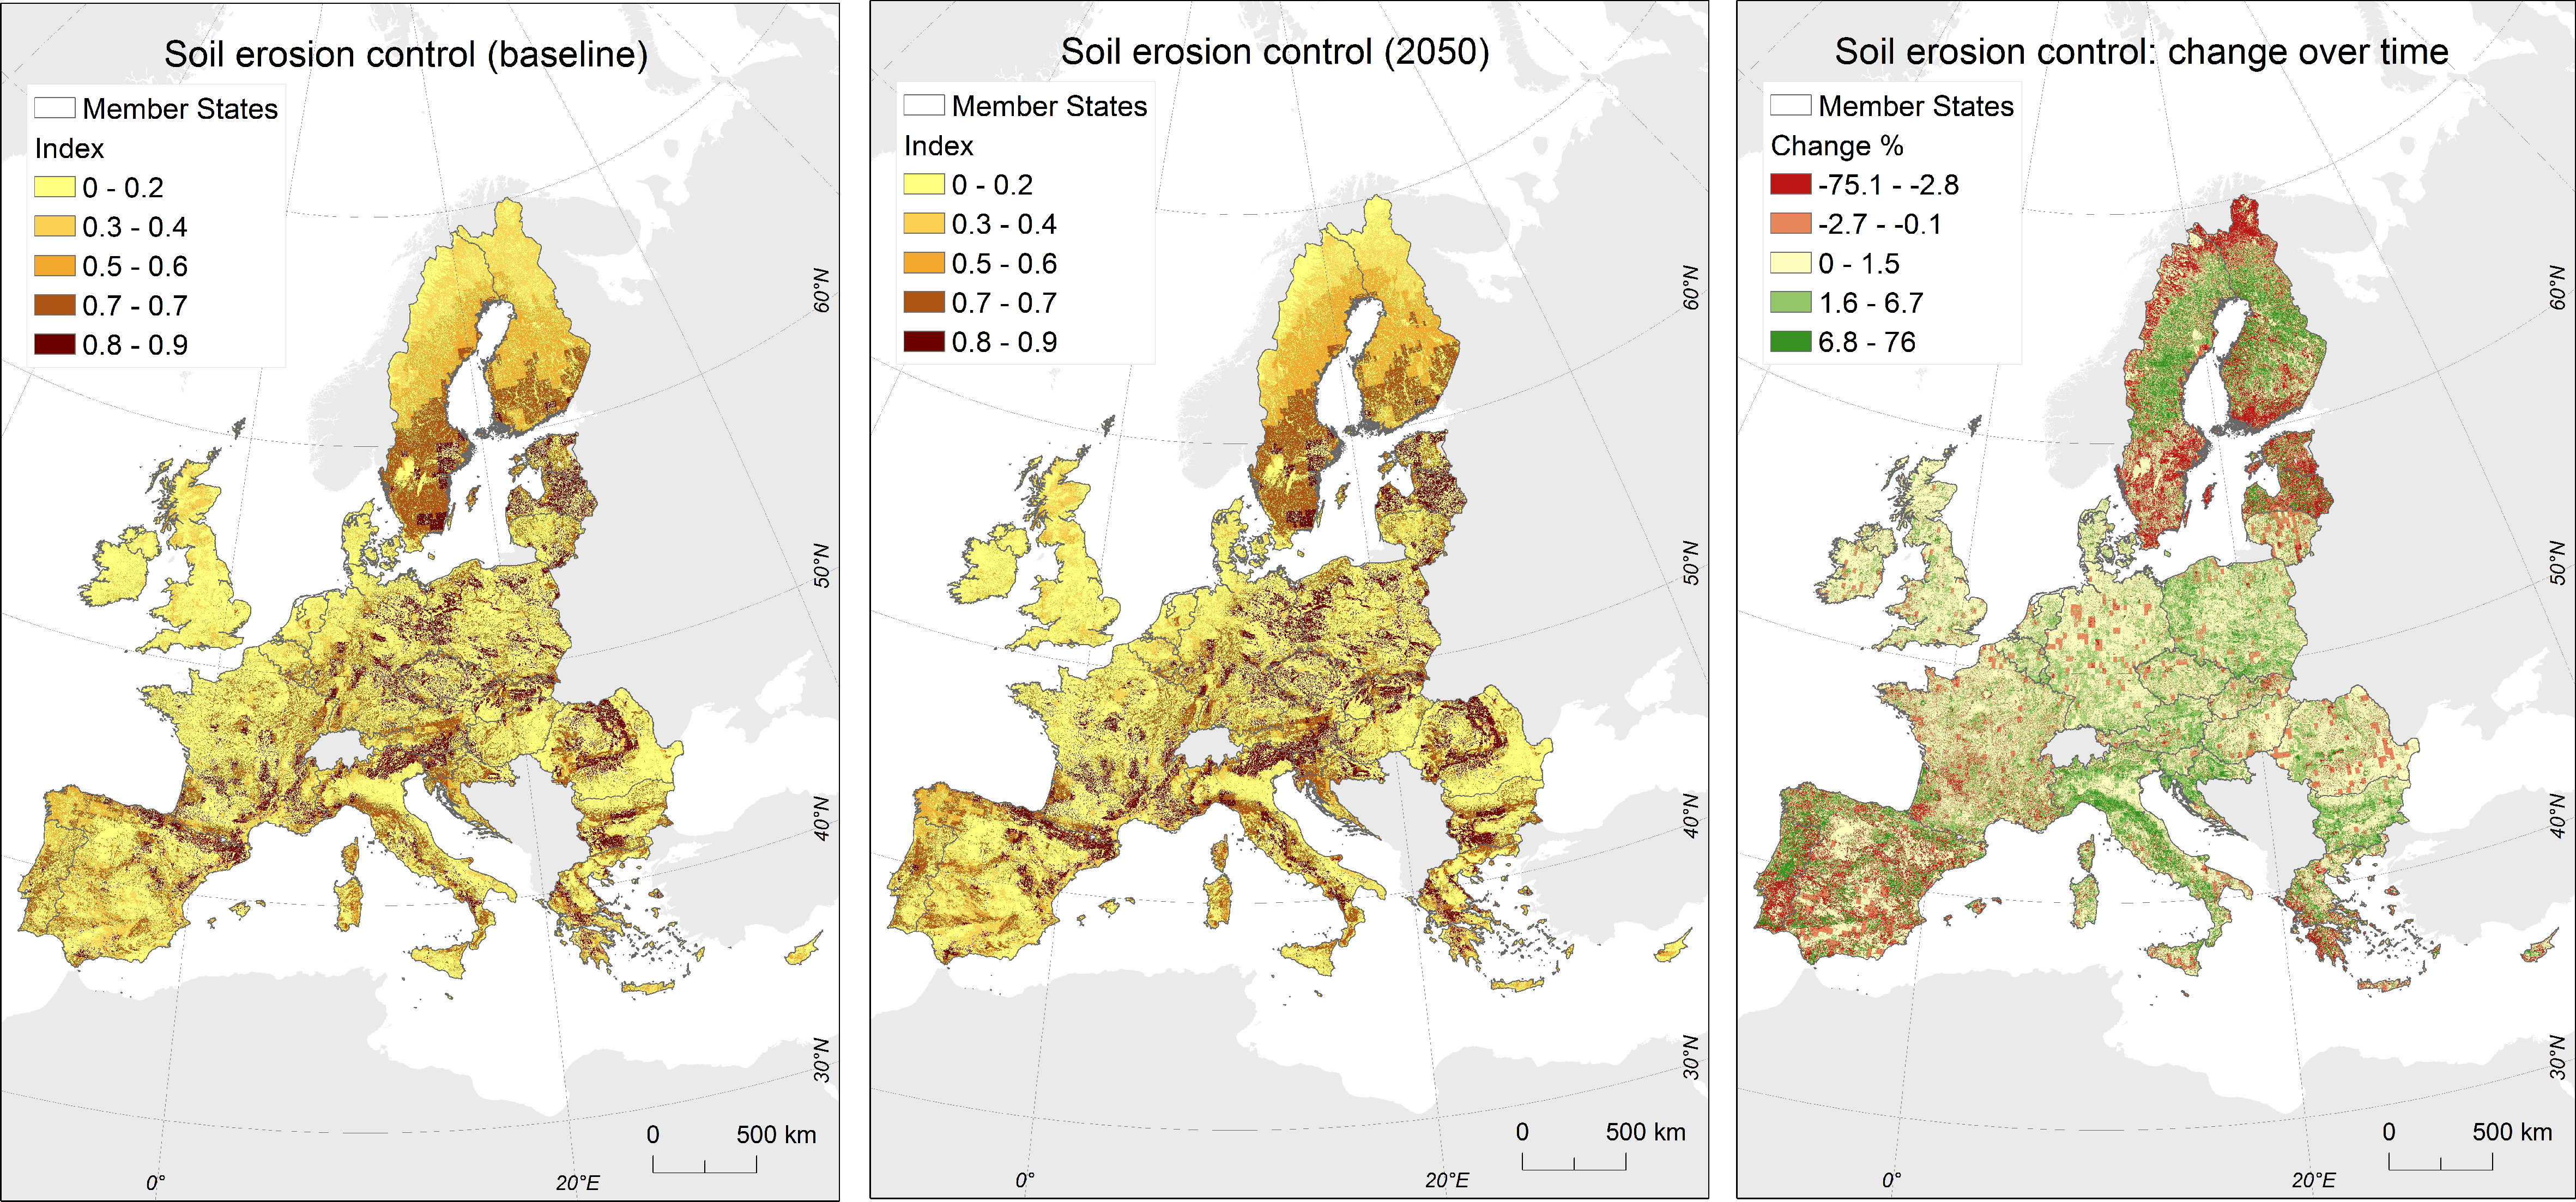
Soil erosion control for the baseline, the 2050 and as a percent change over time (2050 vs. baseline). For the baseline and the 2050 maps, classes represent equal intervals over the range of rendered predictions; for the percent change over time, the visual representation reflects the distribution of the values. Maps are displayed using the Projected Reference System LAEA. See main text for additional details.