|
|
||
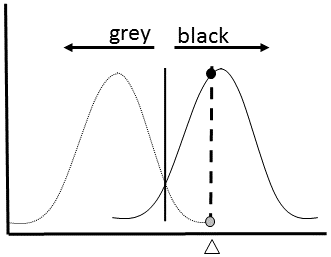
| Probability Density Plot: A Bayesian classifier calculates a probability density for each class (solid and dotted curve) across a range of values for the new datum (white triangle), which is classified according to which probability is highest at its value (black). The value for which the datum has an equal probability of being in both classes is called the decision boundary (black line). | ||
| Part of: Thessen A (2016) Adoption of Machine Learning Techniques in Ecology and Earth Science. One Ecosystem 1: e8621. https://doi.org/10.3897/oneeco.1.e8621 |